Overview

3 Testing and Evaluating Hypotheses

This chapter shows how to move from broad questions to testable, evaluable hypotheses and why early alignment on the question, hypothesis, and deliverable prevents downstream rework. It adopts a probabilistic mindset, emphasizing that analysts gather evidence rather than “proof,” and that clarity about assumptions, uncertainty, and decisions is central to rigorous, business-relevant analysis. The material blends research-methods fundamentals with applied, real-world examples to frame testing and evaluation in organizations where data, context, and constraints are imperfect.

Readers learn to inform hypotheses through a three-pronged approach—targeted research, stakeholder interviews, and exploring available organizational data—often coupled with opportunity sizing to estimate impact and prioritize work. The chapter formalizes hypothesis construction (clear independent and dependent variables, concise declarative expectations, and, when possible, directional predictions) and encourages quantification of expected effects to set concrete evaluation criteria, borrowing intuition from Bayesian thinking about plausible effect sizes. A running case study follows an analyst at a non-profit who synthesizes literature, elicits stakeholder goals, mines internal evidence, and translates all of this into explicit, measurable hypotheses about volunteer registration and downstream outcomes.

Methods of gathering evidence are organized into descriptions, associations, and experiments, with practical guidance and cautions: descriptive statistics inform but do not imply generalization; correlations aid planning yet do not establish causation; experiments (including quasi-experiments) enable stronger causal claims when design conditions are met. The chapter outlines common study designs—between-subjects, within-subjects (repeated measures), cohort, and longitudinal—and connects them to typical organizational programs: basic/applied research, scaled A/B testing, and program evaluation. Throughout, it stresses disciplined communication (“evidence,” not “proof”), stakeholder guidance on interpretation, and iterative follow-up, culminating in a complete evaluation plan that integrates descriptive trends, associations, hypothesis tests, and longitudinal tracking to inform decisions and improve outcomes over time.

Many frustrating situations can be avoided by aligning on the question, hypothesis, and expected deliverable.
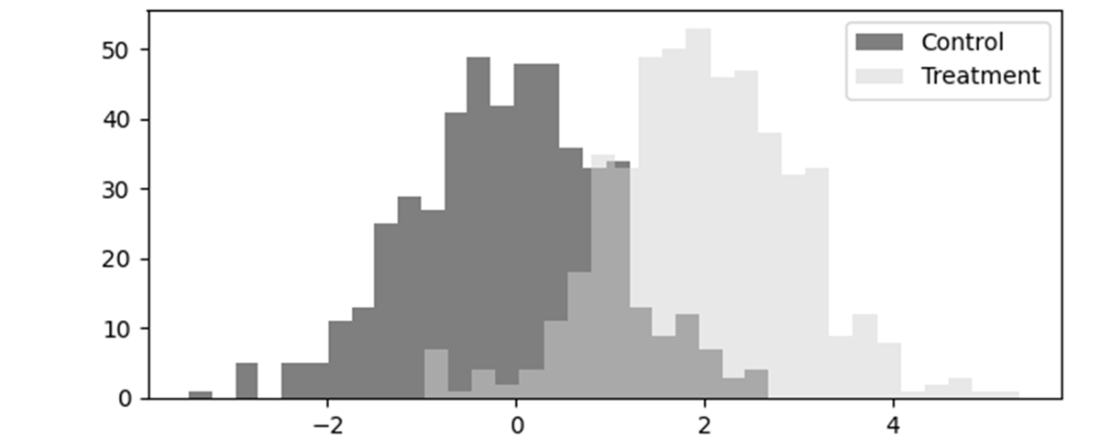
Distributions showing a hypothetical group difference between the treatment and control group.
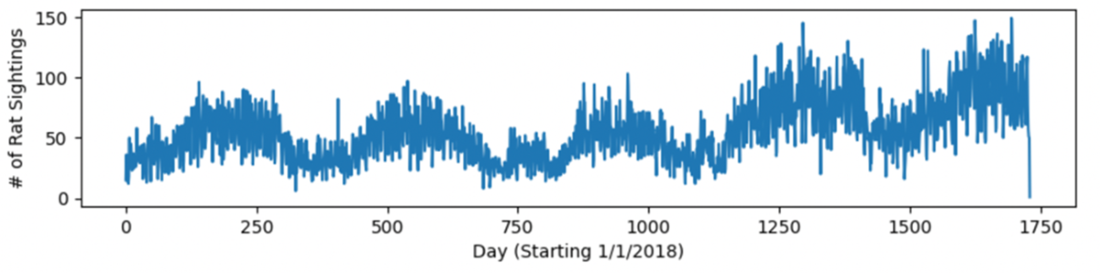
Time series plot of daily reports of rat sightings in NYC.
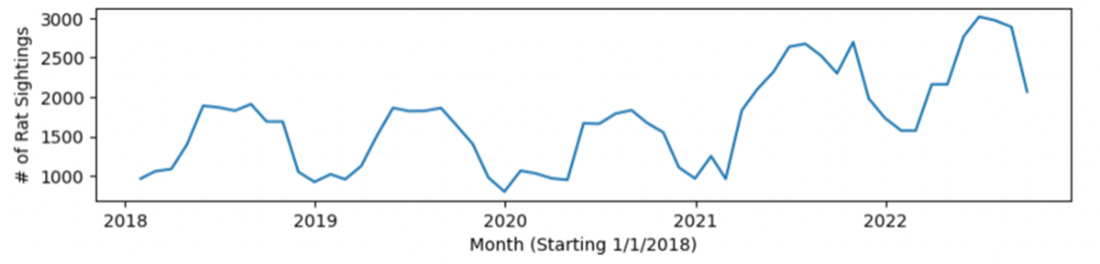
Time series plot of total monthly rat sightings in NYC.
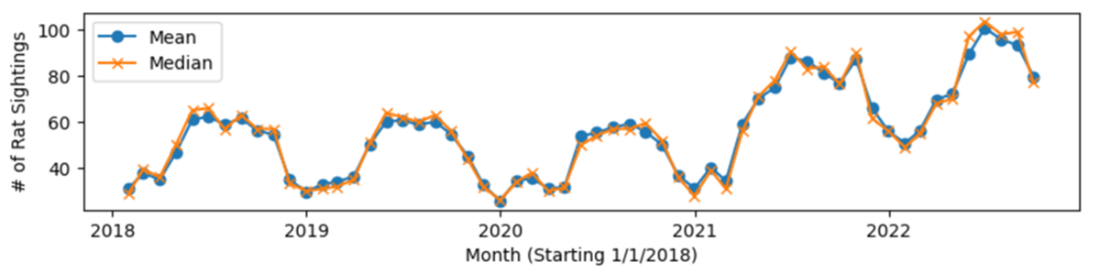
Time series plot of mean and median monthly rat sightings in NYC.
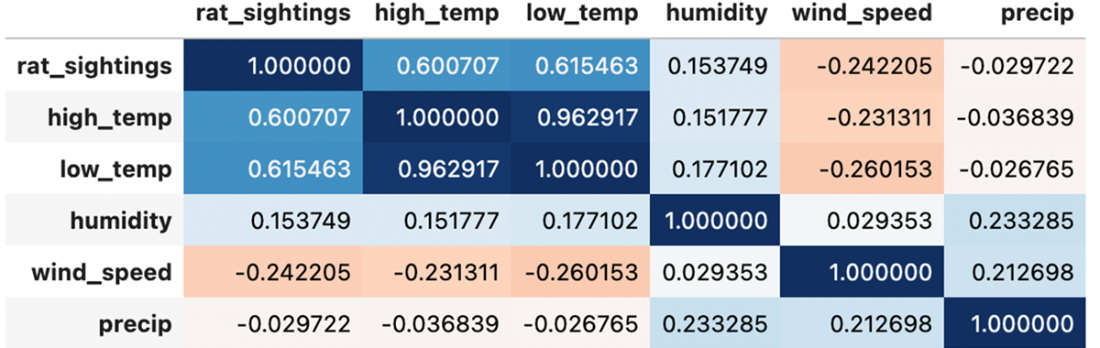
Pearson’s Correlations between the number of daily rat sightings and weather parameters.
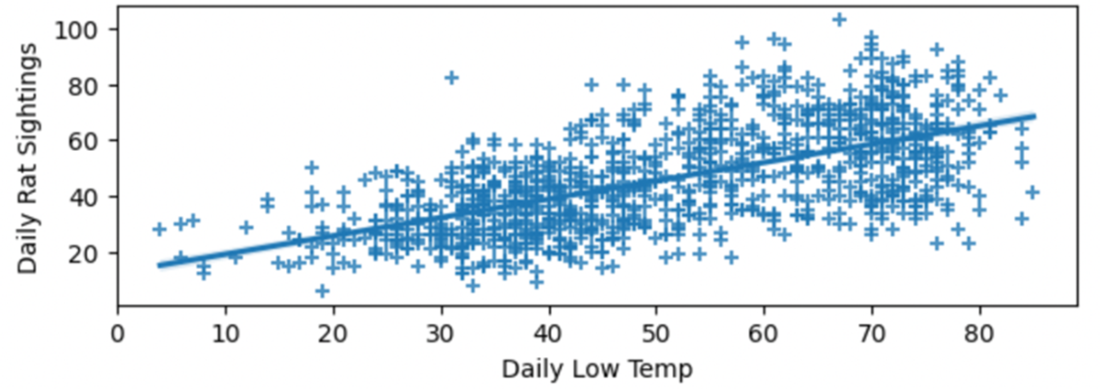
Scatterplot of daily high temperatures vs. daily rat sightings.
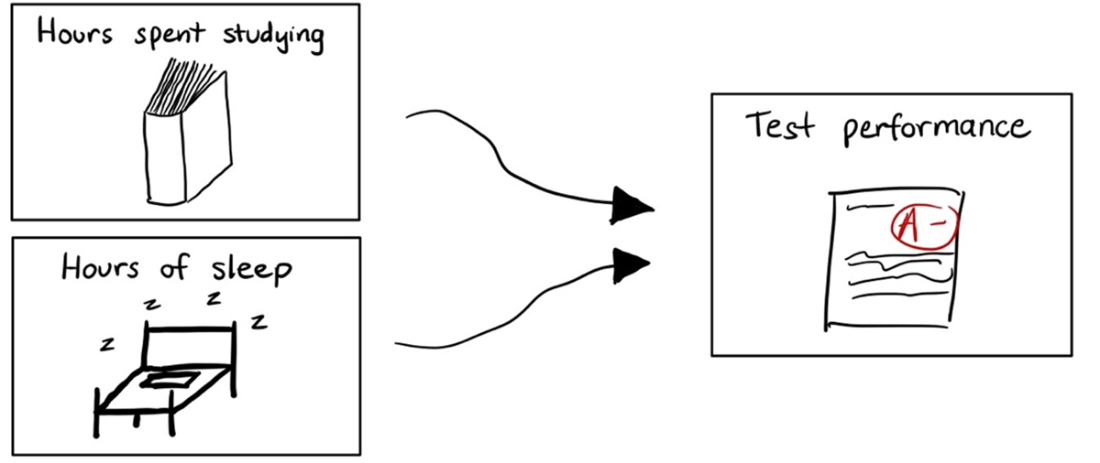
A hypothesized causal relationship between two independent and one dependent variable.
Quasi-experiments have a similar design to controlled experiments without random group assignment.
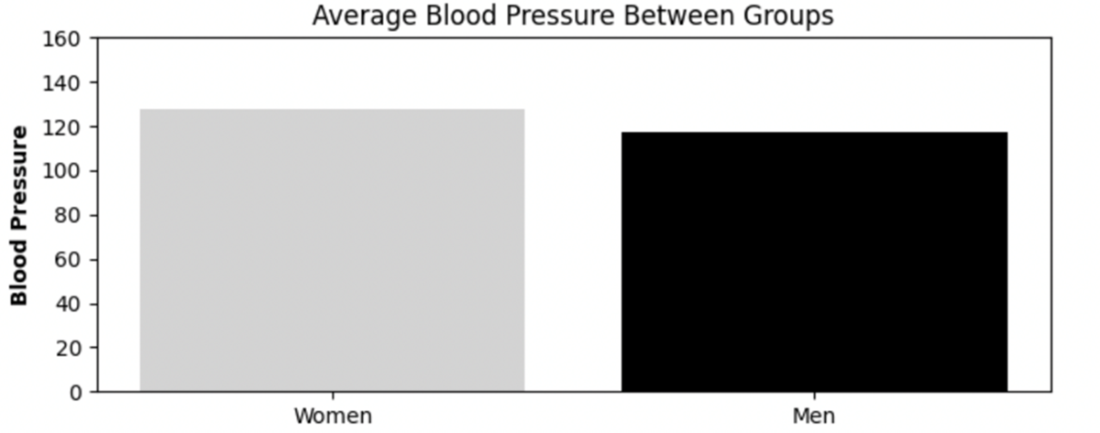
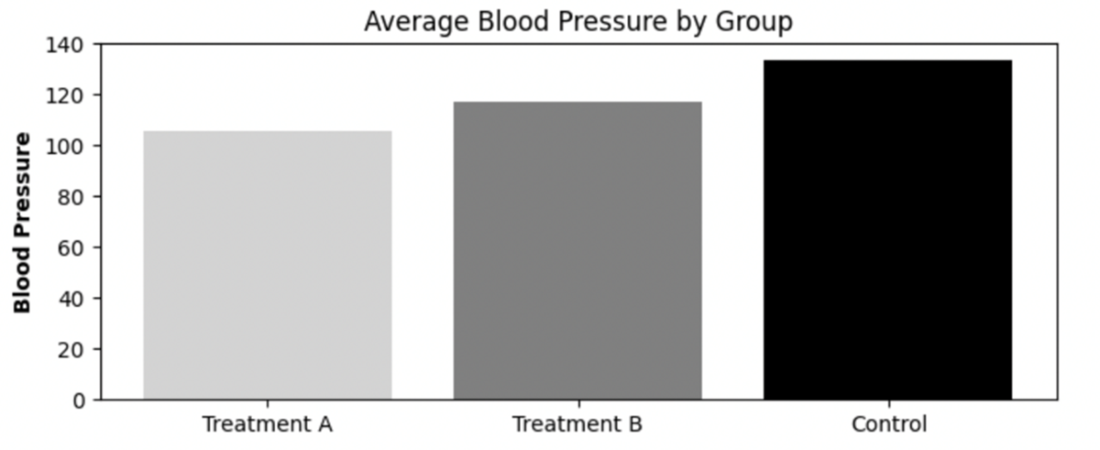
Between-subjects comparisons evaluate differences between mutually exclusive characteristics or assignments.
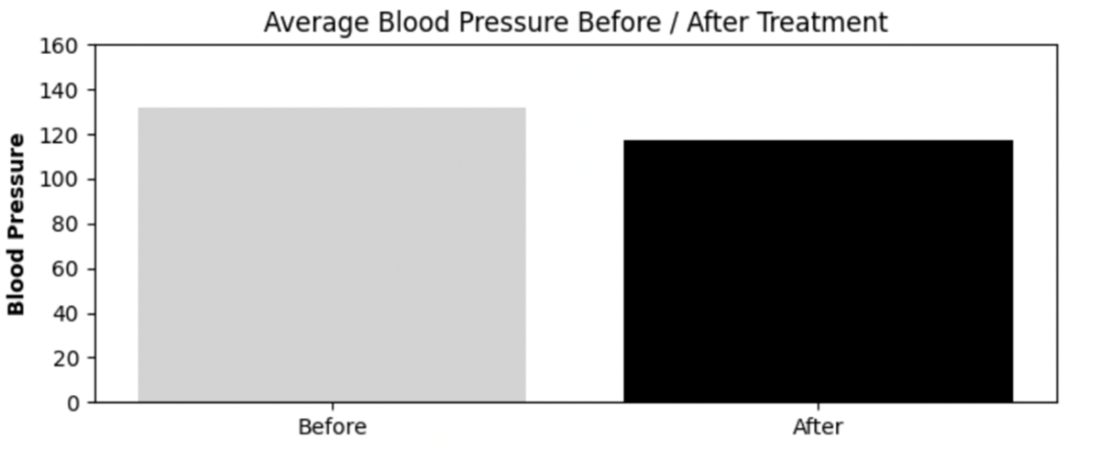
Within-subjects comparisons evaluate differences before and after treatment.
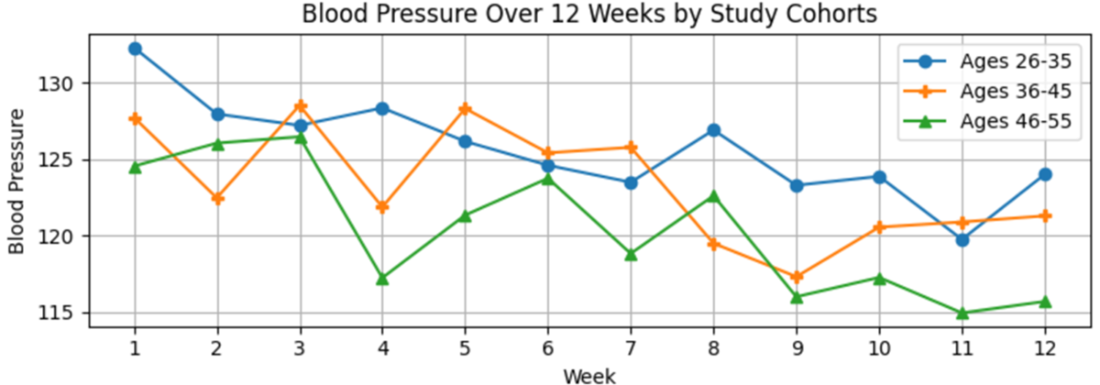
Cohort comparisons evaluate meaningful cohort groups over time.
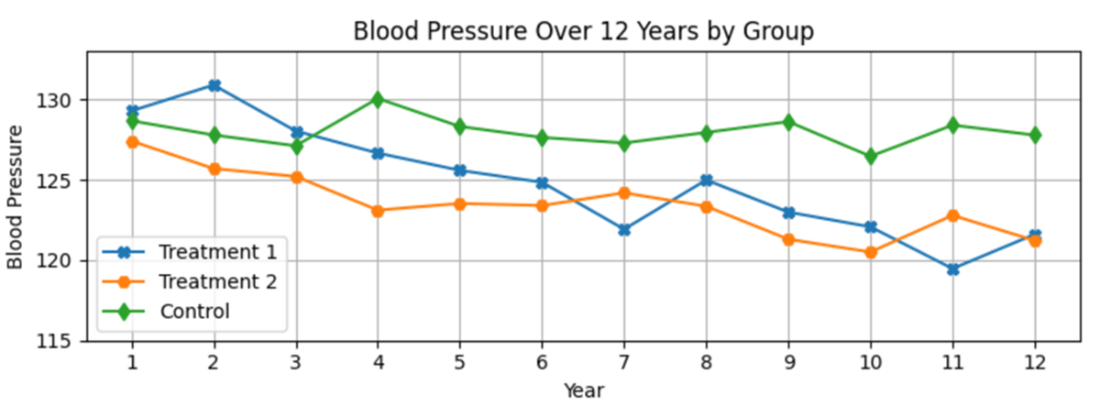
Longitudinal comparisons evaluate participants over months, years, or even lifetimes.
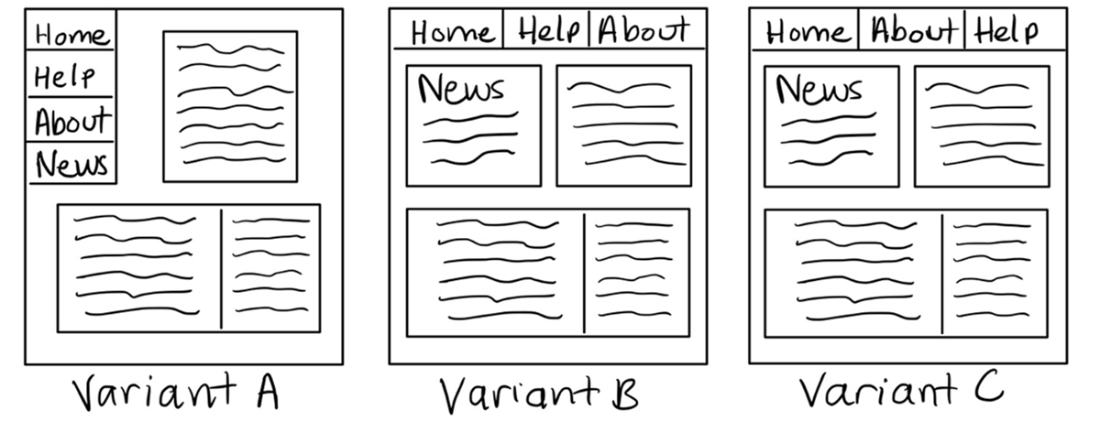
Example of an A/B/C group comparison with minor changes to a website.
Summary

  • Developing a data-informed and quantifiable hypothesis involves synthesizing peer-reviewed and public research, gathering stakeholder information, and conducting foundational analyses of available data at your organization.
  • Research the process of investigating a topic as a study or experiment to gain new information about that topic. The goal is to accumulate information over time, enabling you to build expertise and better inform decisions, practice, and policy.
  • Data can be evaluated as one of the following:
    • Descriptive information, which seeks to describe only existing information in a dataset without making inferences, predictions, or quantifying the relationships between variables.
    • Correlations, which measure a non-causal linear association between two variables. Correlations range from -1 to 1, with values further from 0 indicating a stronger relationship.
    • Causal/predictive analyses aims to determine if one phenomenon (your independent variable) causes something else to happen (your dependent variable). This is usually tested as an experiment under controlled settings to be able to confidently isolate an independent variable as the cause of the dependent variable.
  • Experimental designs comparing differences between groups are often set up as between-subjects comparisons (e.g., random assignment between an experiment and control group) or within-subjects designs (e.g., a single experiment group compared before and after treatment). These standard designs allow for comparison across vast arrays of research.
  • Cohort comparisons (e.g., participants grouped by age and tracked for the duration of an experiment) and longitudinal studies (tracking participants over long periods) are less common due but highly valuable in many domains of study, research, and work.
  • Individual study designs usually become part of more extensive research programs within an organization.
    • Basic and applied research programs seek to contribute to the overall knowledge base about a specific topic. These are common in academic settings.
    • A/B testing programs seek to continually improve on a product and/or business outcome through a continuous program of concurrent or successive experiments run on large numbers of users for short periods of time. These programs are common in marketing and product analytics, and are primarily run in business settings.
    • Program evaluations are typical in non-profit and government environments. These seek to evaluate the efficacy of new and ongoing programs for the populations they serve, continually improving their ability to achieve a specific goal (e.g., reducing rates of cancer).

FAQ

Why is it worth investing so much effort in defining hypotheses before testing?Because hypotheses are the foundation of analysis. A clear, well-motivated hypothesis aligns stakeholders on the question, expected outcomes, and deliverable; guides choice of methods and study design; and makes results easier to interpret. Even though it may be a few sentences in the final report, the rigor you apply here drives the quality and credibility of the entire project.
How can I quickly gather background information to inform a hypothesis in a new domain?Use three complementary avenues: - Research: Identify relevant academic domains, find 3–10 recent peer‑reviewed papers, evaluate methods/samples close to your population, and scan synthesized sources (government reports, industry write‑ups). - Stakeholder interviews: Ask domain experts for context, sources that informed the request, and their expected outcomes. - Exploration of available data: Review internal reports, databases, and prior evaluations to understand feasibility, definitions, and historical baselines.
What should I ask stakeholders to align on expectations and close context gaps?Focus on three areas: - General context: Why this project, and why now? - Background information: Which sources (people, papers, reports) shaped their thinking? - Expected outcomes: What do they hypothesize will happen, how will success be used (e.g., decisions, grants), and what is the value of success or failure?
What is “opportunity sizing,” and how do I do it?Opportunity sizing estimates the potential impact of a project to inform prioritization. Combine: - External context: Research, market/benchmarks, public datasets. - Internal evidence: Historical performance, demand signals (e.g., user requests, grants), and capacity constraints. - Output: A reasoned range for the number of users, behaviors, revenue, or outcomes affected, plus key assumptions.
How do I write strong null and alternative hypotheses?Best practices: - Specify independent variables (predictors) and dependent variables (outcomes). - Make a clear, declarative alternative hypothesis; include a direction when appropriate (e.g., higher/lower). - Keep it concise and interpretable for non-specialists. - Remember: studies provide evidence to reject the null in favor of the alternative; otherwise, you fail to reject the null.
Why and how should I quantify a hypothesis?Quantification sets explicit expectations for magnitude, not just direction, encouraging probabilistic (often Bayesian-leaning) thinking. How: - Use prior studies, internal historical data, and stakeholder domain knowledge to estimate plausible effect sizes (e.g., a 50% vs. 25% registration rate). - Translate estimates into concrete targets and ranges that can be evaluated against observed results.
When are descriptive analyses appropriate, and what pitfalls should I avoid?Use descriptions to summarize phenomena, explore new data sources, define metrics, and provide rapid decision support. Avoid pitfalls: - Don’t infer population-level truths from a single mean/median or trend. - Don’t treat group differences in descriptive stats as “significant” without proper tests. - Don’t imply causation; clarify what the data can and cannot support, and guide stakeholders on interpretation.
How should I use correlations responsibly?Guidelines: - Choose the right measure: Pearson for linear associations with continuous data; Spearman for ordinal data or rank-based relationships. - Visualize: Inspect scatterplots and check linearity; consider curvilinear patterns if needed. - Communicate limits: Correlation ≠ causation. Use associations for planning and hypothesis generation, not causal claims.
What distinguishes a sound experiment from a quasi-experiment?Sound experiments aim to establish causality via: - Random selection (when possible) and random group assignment. - Controlled conditions that isolate the manipulated independent variable. - Direct manipulation of the treatment. Quasi-experiments compare inherent participant characteristics (e.g., age, region) without random assignment. They’re common and useful but require extra care to manage confounds and interpret results.
Which study designs should I know, and when do they apply?Core designs: - Between-subjects: Compare independent groups (e.g., treatment vs. control). - Within-subjects (repeated measures): Measure the same participants across conditions or time (pre/post or multiple waves). - Cohort comparisons: Track defined groups (e.g., signup year, age bands) over time. - Longitudinal studies: Repeated measurements over extended periods; may mix between- and within-subjects comparisons to analyze trends and persistence.
How do basic/applied research, A/B testing, and program evaluation differ?Differences in scope and goals: - Basic research: Accumulates knowledge to advance theory over successive studies. - Applied research: Produces actionable insights for a specific population or setting. - A/B testing: Rapid, iterative between-subjects experiments on products/websites to optimize key metrics at scale. - Program evaluation: Ongoing assessment of initiatives (often in nonprofits/government) with defined outcomes, follow-ups, and cost-effective improvement over time.

pro $24.99 per month

  • access to all Manning books, MEAPs, liveVideos, liveProjects, and audiobooks!
  • choose one free eBook per month to keep
  • exclusive 50% discount on all purchases
  • renews monthly, pause or cancel renewal anytime

lite $19.99 per month

  • access to all Manning books, including MEAPs!

team

5, 10 or 20 seats+ for your team - learn more


choose your plan

team

monthly
annual
$49.99
$499.99
only $41.67 per month
  • five seats for your team
  • access to all Manning books, MEAPs, liveVideos, liveProjects, and audiobooks!
  • choose another free product every time you renew
  • choose twelve free products per year
  • exclusive 50% discount on all purchases
  • renews monthly, pause or cancel renewal anytime
  • renews annually, pause or cancel renewal anytime
  • Effective Data Analysis ebook for free

choose your plan

team

monthly
annual
$49.99
$499.99
only $41.67 per month
  • five seats for your team
  • access to all Manning books, MEAPs, liveVideos, liveProjects, and audiobooks!
  • choose another free product every time you renew
  • choose twelve free products per year
  • exclusive 50% discount on all purchases
  • renews monthly, pause or cancel renewal anytime
  • renews annually, pause or cancel renewal anytime
  • Effective Data Analysis ebook for free