2 From Question to Deliverable
This chapter presents a practical, end-to-end framework for turning stakeholder questions into actionable, trustworthy deliverables. It emphasizes aligning on clear definitions, setting realistic expectations, and choosing measures and methods that the available data can actually support. The guidance focuses on making decisions with confidence, communicating insights at the right level for the audience, and building reusable, reproducible work products that sustain long-term impact.
The lifecycle starts by operationalizing vague concepts into measurable outcomes, then selecting feasible data sources—such as clickstream and behavioral logs, customer support records, and surveys—while recognizing their limits (keys and joinability, timestamp semantics, missingness, aggregation, and bias). Analysts are urged to probe dataset characteristics early, run thorough exploratory data analysis, and choose study designs and tests that match the questions (not the other way around). Best practices include budgeting most time for scoping, data preparation, and interpretation, keeping methods as simple as possible, and aligning stakeholders on what results, visuals, and comparisons they should expect.
Effective delivery hinges on clear interpretation tailored to stakeholders’ statistical fluency, avoiding “analytics telephone” by defining scope, using precise language (e.g., association vs causation), and explicitly listing limitations and next steps. The chapter also outlines how to handle results that contradict hypotheses or prevailing beliefs by revisiting measures, context, and representativeness, and by proposing follow-up research. Finally, it stresses reproducibility: document background and rationale, data sources and retrieval steps, cleaning and aggregation choices, EDA and statistical methods, and the code or queries used so peers can re-create, validate, and extend the analysis efficiently.
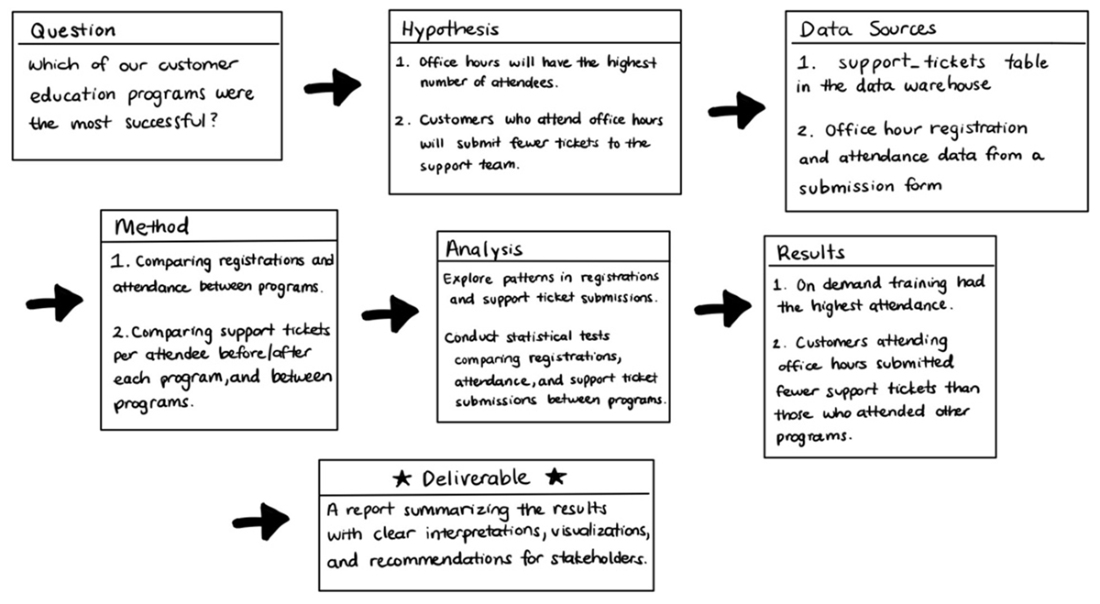
Flowchart of an analytics lifecycle looking at the impact of a customer education and outreach program. Each step distills the question into measurable items that can be analyzed and used to produce actionable recommendations.
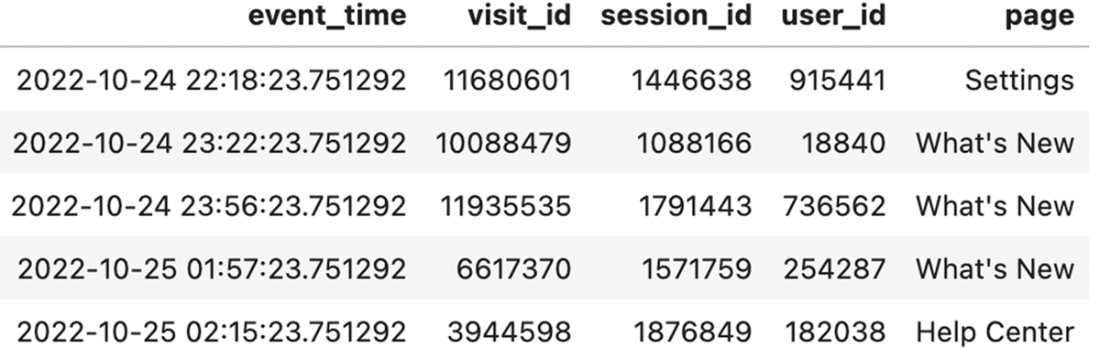
A sample of data from a table on page view events.
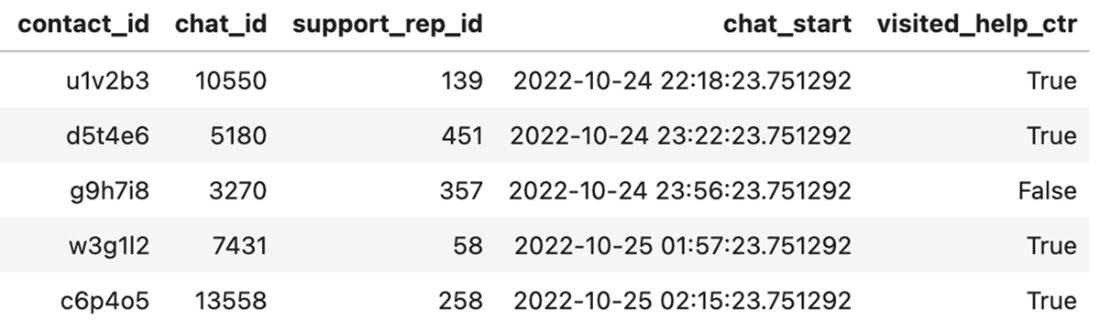
A sample of data from a table on chat support requests.
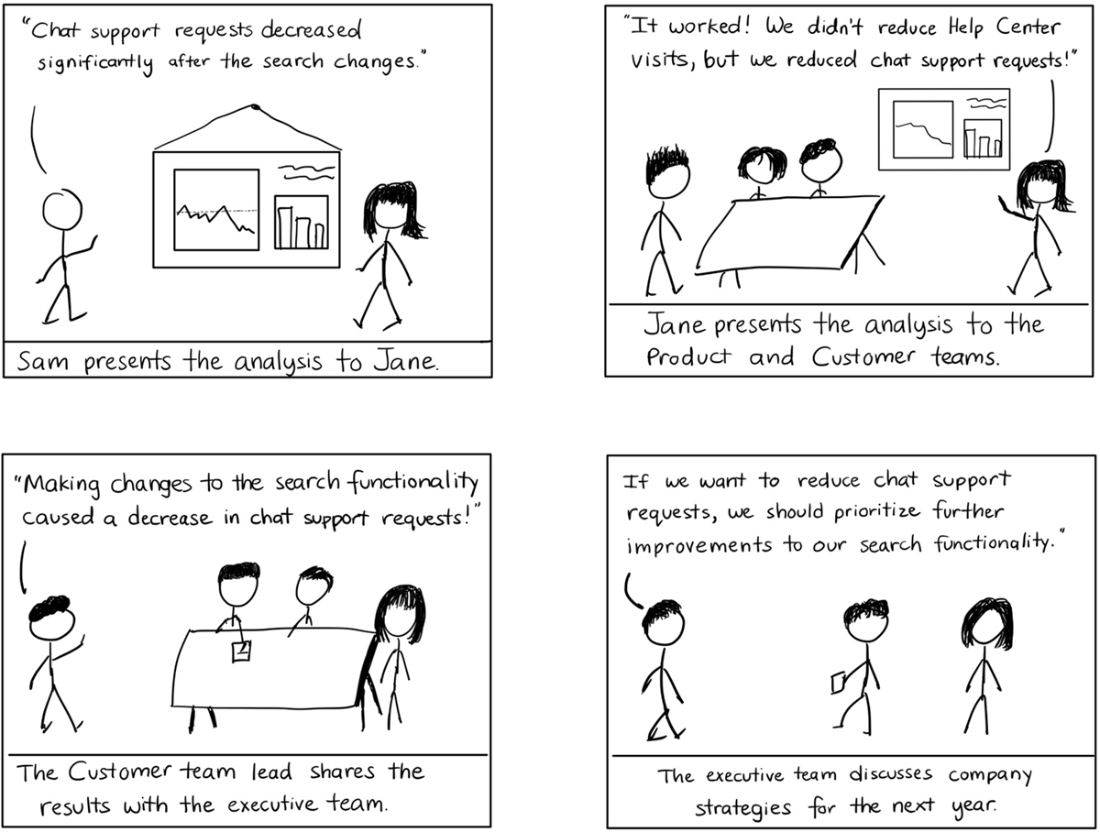
Analytics Telephone can diffuse the quality of your insights.
A slide such as this example that delineates the scope of interpretation helps ensure the long-term success of your work.
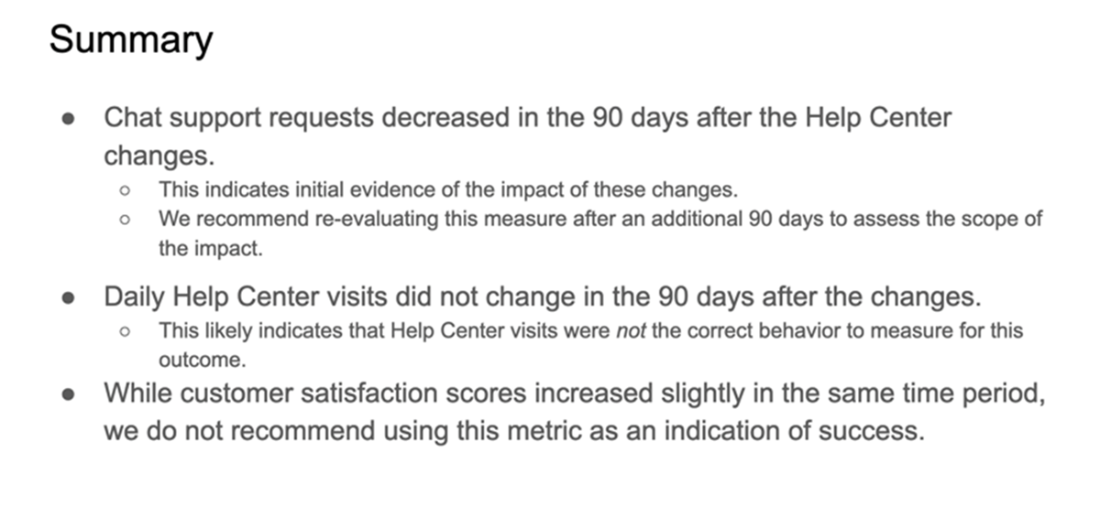
Addendum slide to Sam’s original presentation.
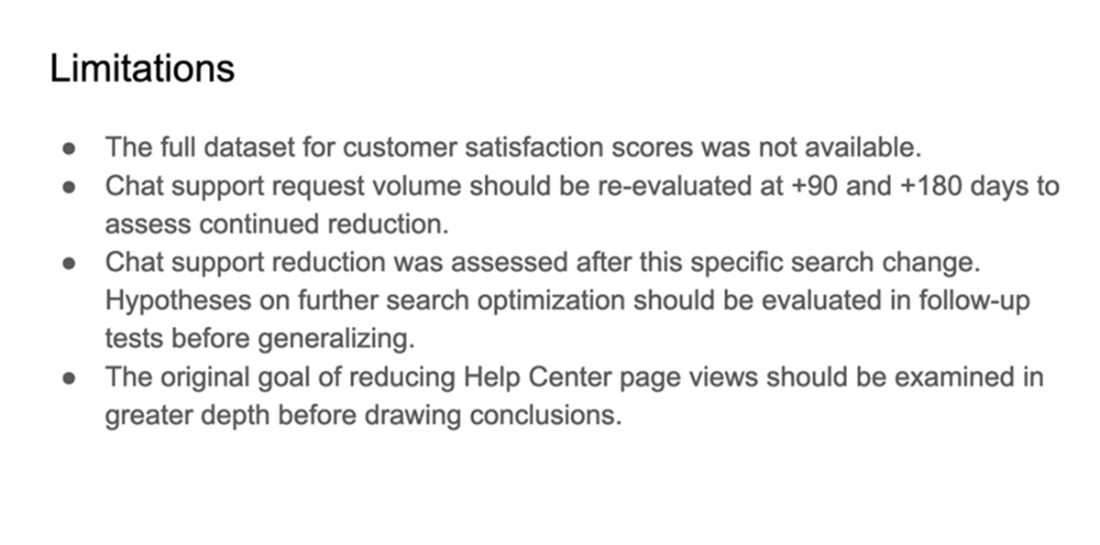
Example quotes referencing qualitative findings.
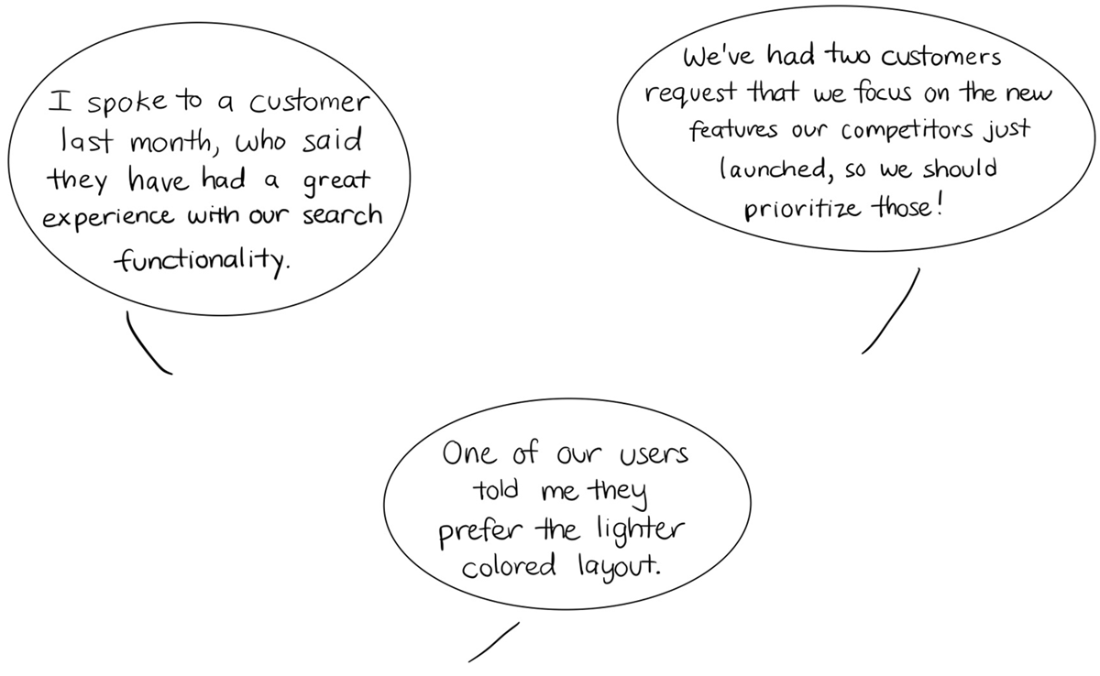
Example quotes referencing common organizational beliefs.
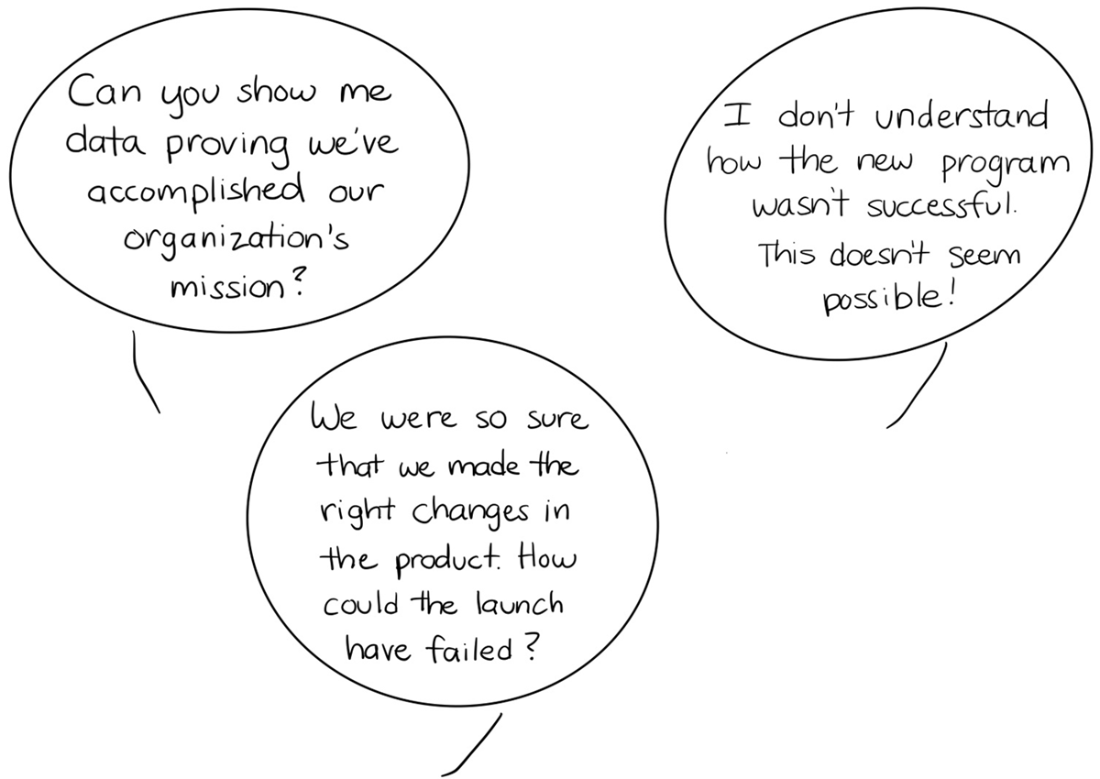
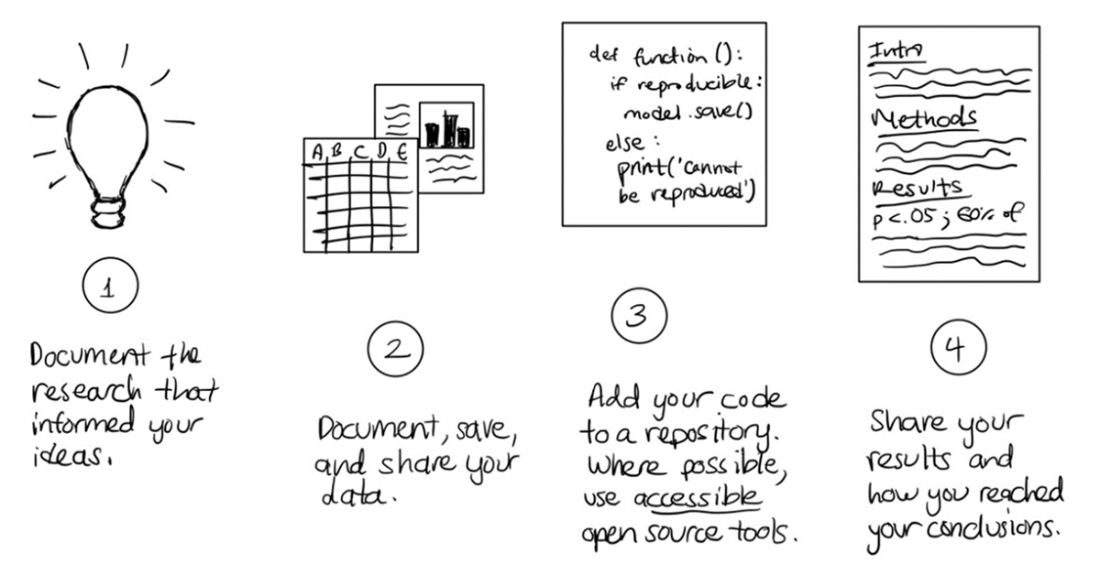
Recommended steps involved in reproducing a project.
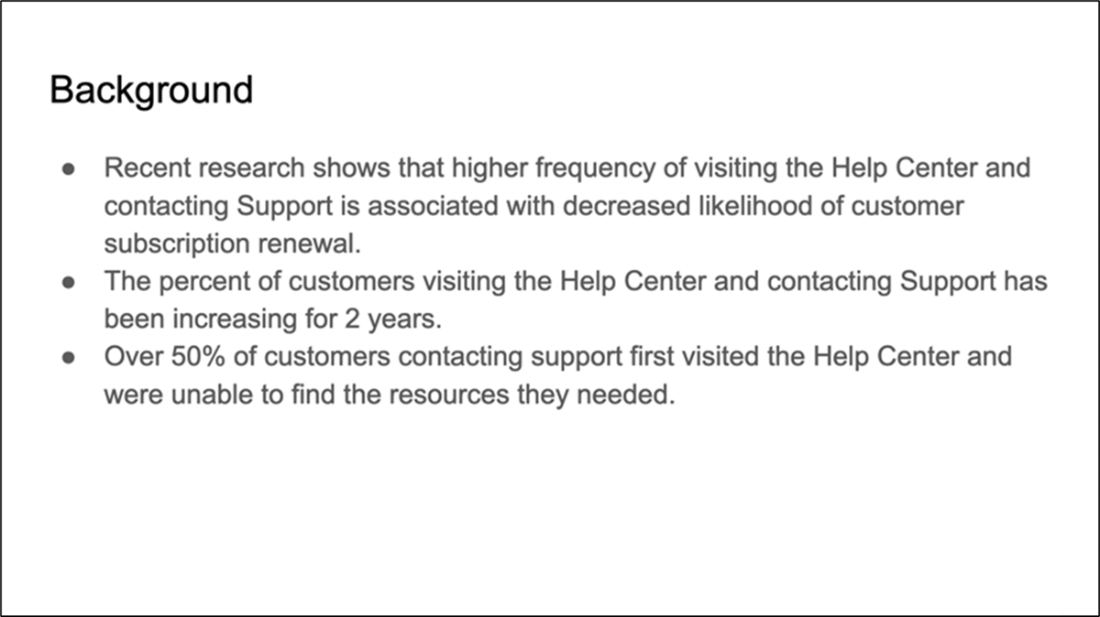
Background slide in Sam’s presentation summarizing information in the long-form report.
Summary
- The lifecycle of an analytics project starts with a question. Previous knowledge motivating the question guides the development of hypotheses, which informs the datasets and methods used to evaluate the question.
- Operationalization involves translating a concept into something measurable. This usually involves working with your stakeholders to take a heuristic (e.g., customer satisfaction) and creating a technical definition that can be directly assessed using data.
- Organizations have many different data sources that can be leveraged for analysis. Some examples include clickstream data (tracking clicks, page views, and other individual events on a website or application), customer support data, and survey data. Each data source has strengths and limitations that you will need to consider when determining if the information you have can be used to answer your question.
- The scope of interpretation is the degree to which you can reasonably generalize your findings beyond the people included in your analysis. Your assessment of the appropriate scope of your findings will help guide your strategic recommendations to stakeholders.
- Communicating results to stakeholders involves tailoring final deliverables to their understanding of analytics, statistics, and previous information about the topic. There are many areas where you can expect follow-up questions and strategies you can apply for responding to common types of follow-ups.
- Documenting your background research, context, datasets, measures, and methods ensures that your work is appropriately reproducible, saves time, improves accuracy, and optimizes your team’s ability to take on new projects.
- Managing the above effectively requires developing an improved understanding of your stakeholders and their needs over time. However, you can apply many great strategies in your work today to better set you up for success.
FAQ
What is the lifecycle of an analytics project from question to deliverable?
The chapter outlines a practical, repeatable flow:
- Align on the stakeholder question and hypotheses; operationalize vague terms into measurable concepts.
- Audit available data sources; identify gaps and refine scope.
- Prepare data and conduct exploratory data analysis (EDA).
- Select an appropriate study design and statistical tests guided by the question.
- Analyze, visualize, and summarize findings.
- Interpret results for the audience; set the scope of interpretation and use precise language.
- Communicate results, limitations, and next steps to stakeholders (and their stakeholders).
- Document methods, data, and code to ensure reproducibility.
How do I operationalize a vague stakeholder question?
Turn abstractions into measurable definitions:
- Identify ambiguous terms (e.g., “easier,” “impact,” “engagement”).
- Propose concrete, data-backed proxies practical with current data (e.g., time on page, support volume, satisfaction votes).
- Discuss competing definitions and directionality (when “more” vs “less” is a positive outcome).
- Check for industry standards or validated measures.
- Align and iterate with stakeholders; record hypotheses tied to each measure.
Which data sources are commonly used, and what are their trade-offs?
- Clickstream and behavioral data: Rich user journeys and event sequences; great for A/B tests and attribution. Limits: instrumentation effort, tracking gaps (e.g., ad blockers), large volume, and sometimes missing dwell time.
- Customer support records: Volumes, queue times, resolution times, satisfaction; can proxy product friction. Limits: schema varies by tool, join keys may not align with product data, ingestion friction.
- Survey responses: Flexible for perceptions and self-report. Limits: measurement quality, vendor aggregation, unknown response rates, and difficulty linking to user-level data.
What should I verify about a dataset before analyzing it?
Interrogate dataset characteristics up front:
- Granularity: event-level vs pre-aggregated.
- Keys: Can you join to other sources (shared user/customer IDs)?
- Timestamps: What do they represent (server/client, between-actions, completion times)?
- Missingness/duplicates: Percent missing, reasons, and handling plan.
- Coverage gaps: Known blind spots (e.g., ad blockers) and critical fields that are unavailable.
What is EDA and which steps matter most?
Exploratory data analysis builds understanding and guards against misinterpretation. Typical steps:
- Inspect distributions (histograms/boxplots) and central tendency/dispersion.
- Identify and justify outlier handling.
- Assess missing and duplicate records; decide on imputation/exclusion.
- Compute key summaries (mean, median, SD, min/max, counts, uniques).
How do I choose methods and statistical tests and set stakeholder expectations?
- Lead with the question; let it determine design and tests (e.g., group comparisons, time-before/after).
- Favor the simplest adequate approach first; add complexity only if needed.
- Budget most time for planning, data prep, EDA, and interpretation—not for running tests.
- Align early on outputs (e.g., averages, time-series, boxplots) and the level of statistical detail; consider non-parametric alternatives where appropriate.
How should I present and interpret results for audiences with different data literacy?
- Gauge familiarity with concepts (correlation, significance, means comparisons).
- Use clear summary statements and visuals; include statistics only to the needed depth.
- Avoid academic “Results” recitations unless required; translate methods into actionable insights.
- Be precise with language and explicit about what can and cannot be inferred.
What is “analytics telephone” and how do I prevent misinterpretation?
Analytics telephone is the dilution and distortion of findings as they’re relayed. Prevent it by:
- Defining the scope of interpretation and generalizability.
- Using precise language (associate, predict, suggest) and avoiding causal claims unless warranted.
- Including a clear limitations section and recommended next steps.
- Providing methodological context (sample, time windows, measures) and a basic interpretation guide.
How do I handle results that don’t support hypotheses or contradict common beliefs?
- Significant results opposing a hypothesis: Revisit the hypothesis’ rationale; decompose into testable behaviors.
- No significant relationship: Discuss measurement choices, power/sample size, and alternative metrics.
- Non-significant but directionally aligned: Frame as promising; plan for more data/time.
- Quant vs qual conflicts: Check overlap/representativeness and recency of qualitative inputs; refresh as needed.
- Contradicting entrenched beliefs: Map the origin of beliefs, update research with current users, and plan a roadmap to evolve assumptions.
What does reproducibility entail and what should I document?
Enable peers to rerun and build on your work by documenting:
- Background, questions, and hypotheses (with rationale and sources).
- Data sources, retrieval steps, all queries/code (with comments), and third‑party links.
- EDA steps, measures/aggregations, study design, statistical tests, and evaluation settings.
- Chart titles/labels/descriptions and any unusual summarization choices.
- High-level summaries in stakeholder deliverables with links to technical details.

 Effective Data Analysis ebook for free
