11 The Magic of Well-Structured Data
Well-structured data turns analytics from slow, ad‑hoc wrangling into fast, reliable decision-making. The chapter highlights how analysts often spend more time preparing data than analyzing it, and how the “shape” of data—messy, nested, inconsistent, or slow to query—drives that effort. Investing in data modeled for analysis accelerates insight generation, reduces rework, and broadens data self-service across an organization by making data accurate, consistent, and easy to use.
The text surveys the data stack and the practices that make it effective: gathering data via connectors or custom pipelines, choosing storage suited to the data (relational warehouses for structured analytics, document databases for evolving nested records, and data lakes as flexible landing zones), and selecting processing patterns (ETL to transform before loading versus ELT to transform in-warehouse) based on complexity, sensitivity, latency, and cost. It emphasizes data quality as foundational—checking accuracy, completeness, consistency, and timeliness with automated tests in pipelines and models—and shows how tools like dbt make collaborative transformations, layered models, and built-in tests approachable for SQL-savvy teams. Finally, it promotes leveraging metadata and data catalogs to document lineage, definitions, and usage so stakeholders can find, trust, and apply the right data without bottlenecks.
To maximize analytical value, the chapter advocates analytics engineering: partnering with analysts to codify common joins, calculations, and definitions into curated models and schemas. A key pattern is star schema design—denormalizing source systems into fact tables that capture business events and dimension tables that provide rich, human-readable attributes—so queries are simpler, faster, and more consistent. Done collaboratively, this approach standardizes metrics, improves performance, and enables true self-service analytics, letting analysts spend less time on plumbing and more time generating insights that move the business.
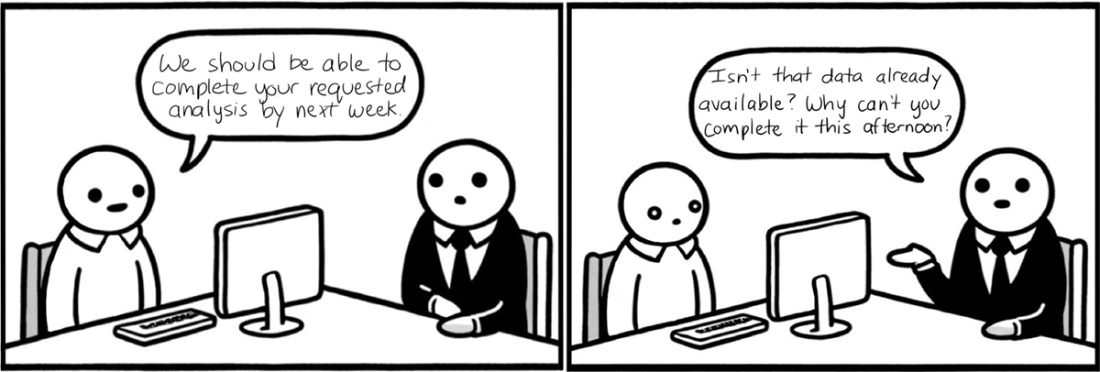
When your colleagues don’t understand that data can’t be “conjured,” it can feel like data analysts are expected to wave a magic wand and generate insights.
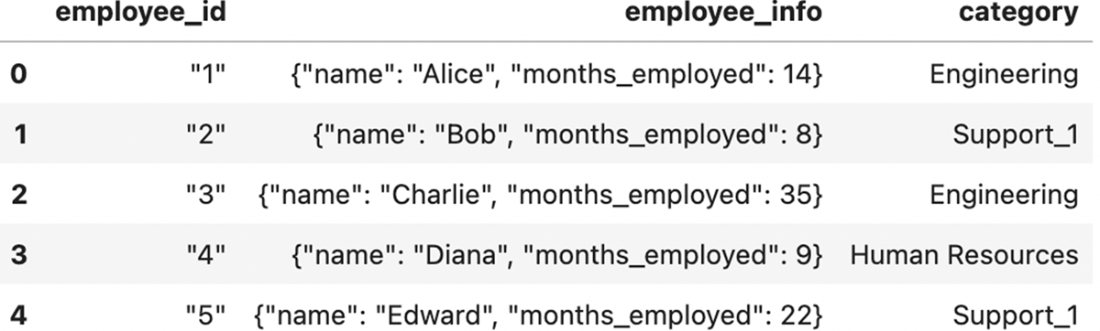
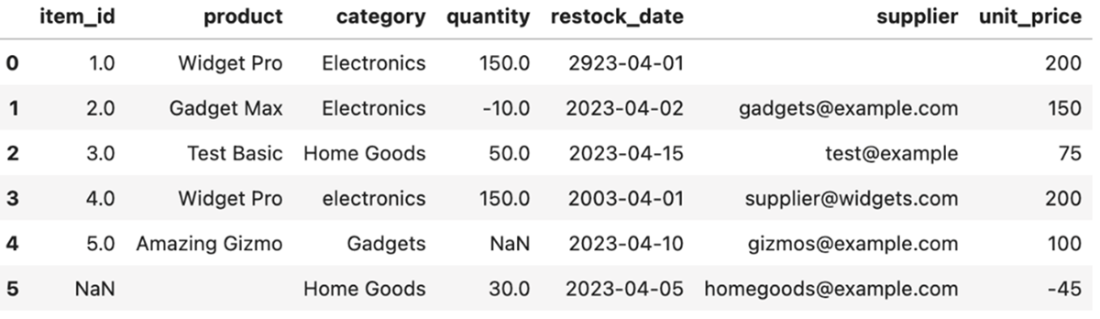
Messy, unstructured, and non-tabular data can be more challenging to analyze.
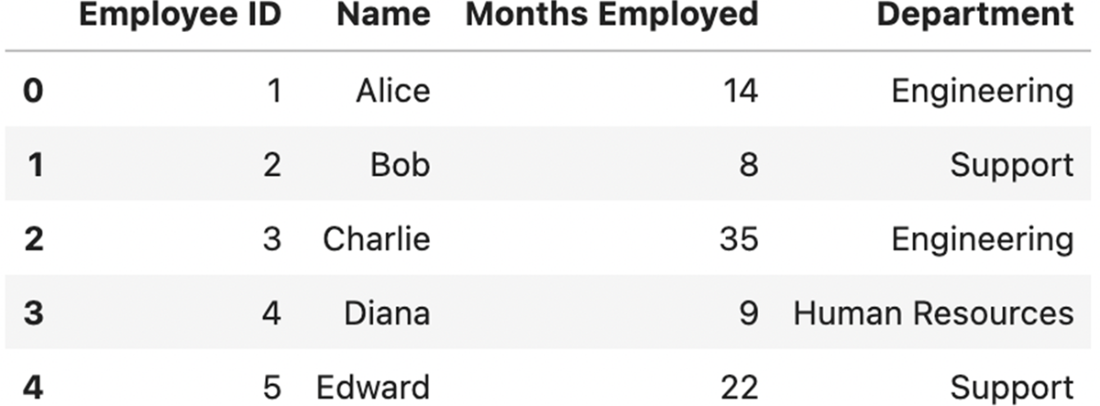
The same data as figure 11.2, after it’s been cleaned and structured for analysis.
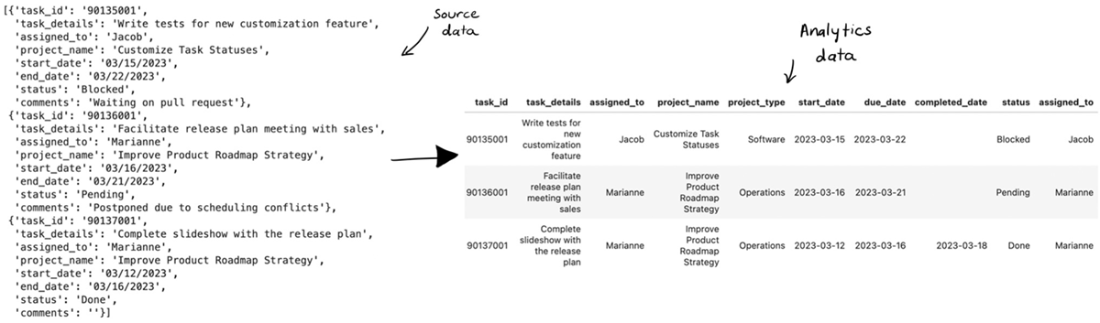
When data reaches your doorstep, it often looks nothing like it did at the source.
Data in a warehouse is combined to create cohesive information about a business process.
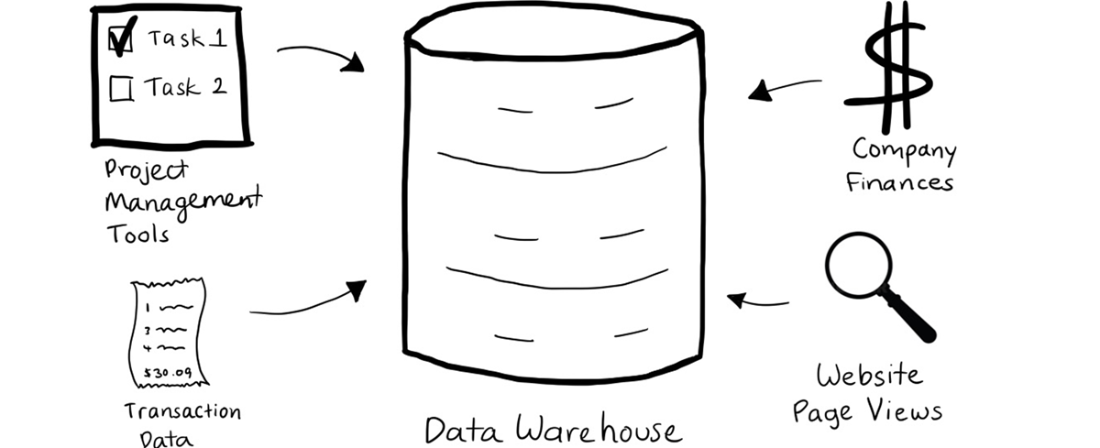
Data warehouses contain sets of information that can be divided into databases and schemas.
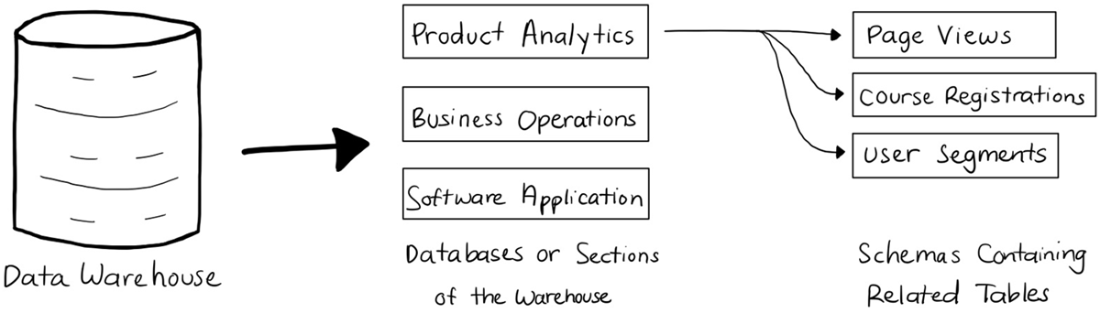
An example of a document structure in JSON that may exist in a document database.
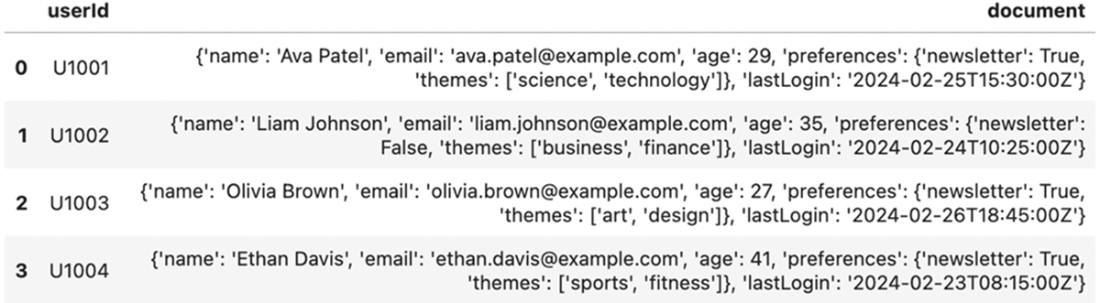
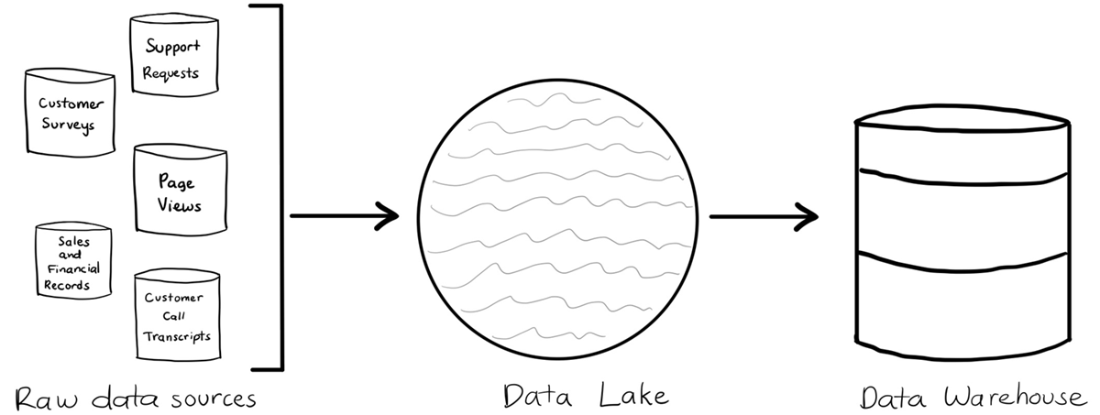
Data lakes are the first landing point for the data organizations synthesize for analysis.
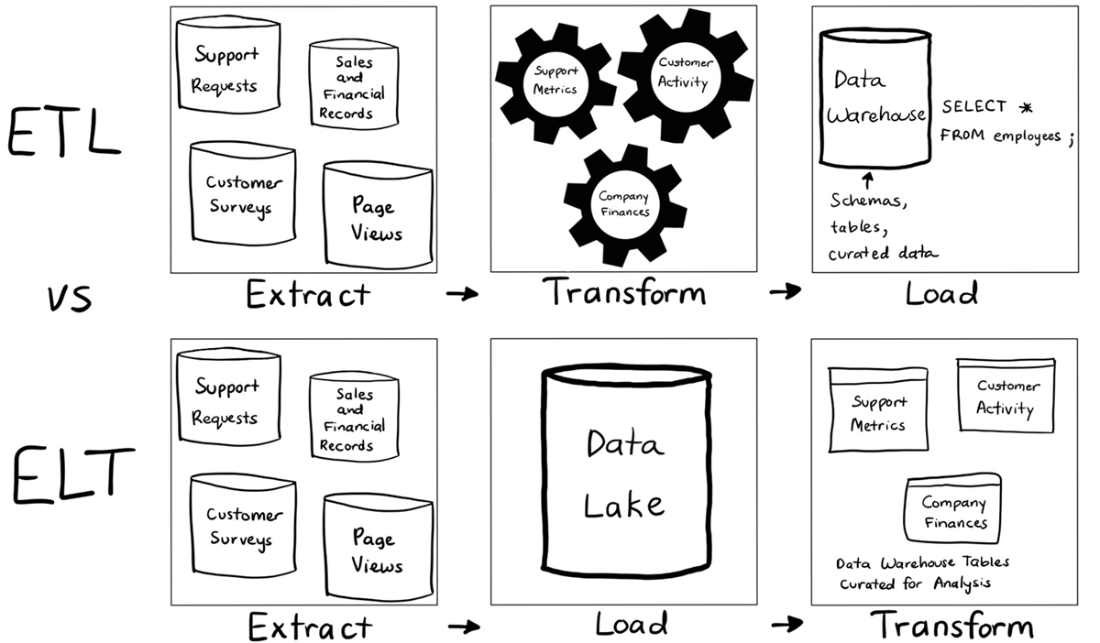
ETL and ELT processes transform the data at different steps, leading to structured data in the warehouse.
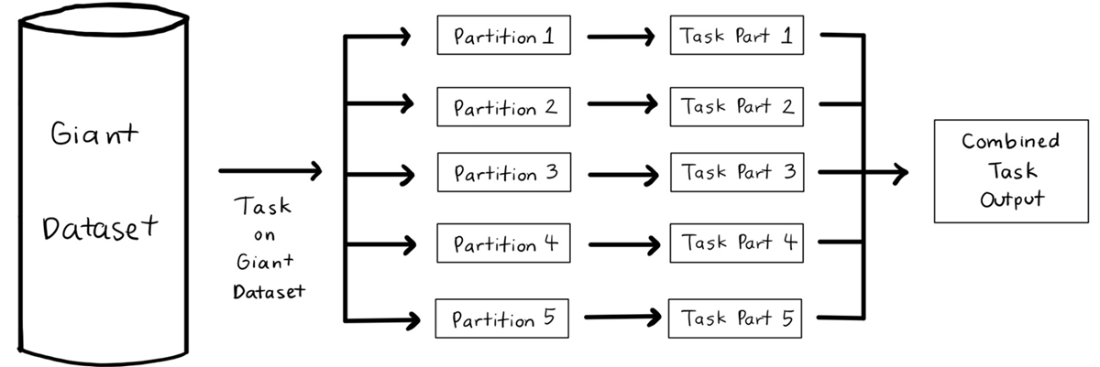
Parallel processing divides a data processing task into manageable chunks and recombines it into the final output.
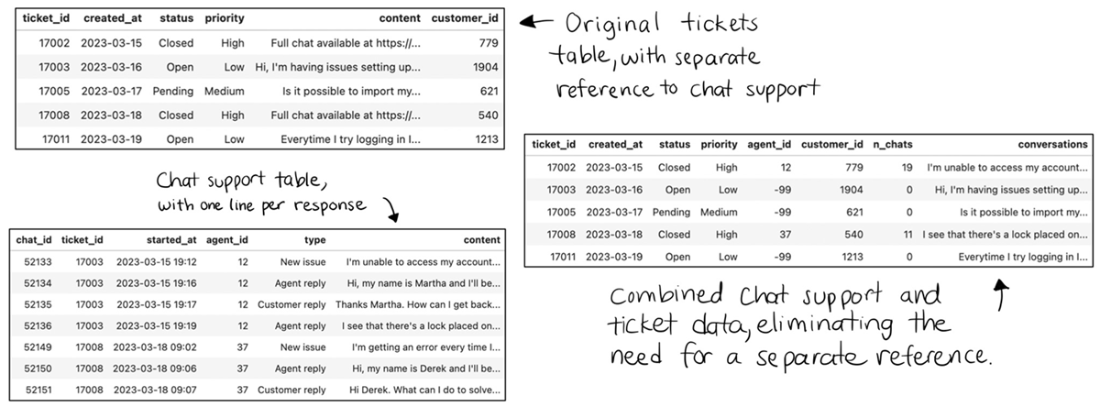
Structuring data in a warehouse involves ensuring it can be easily and accurately queried.
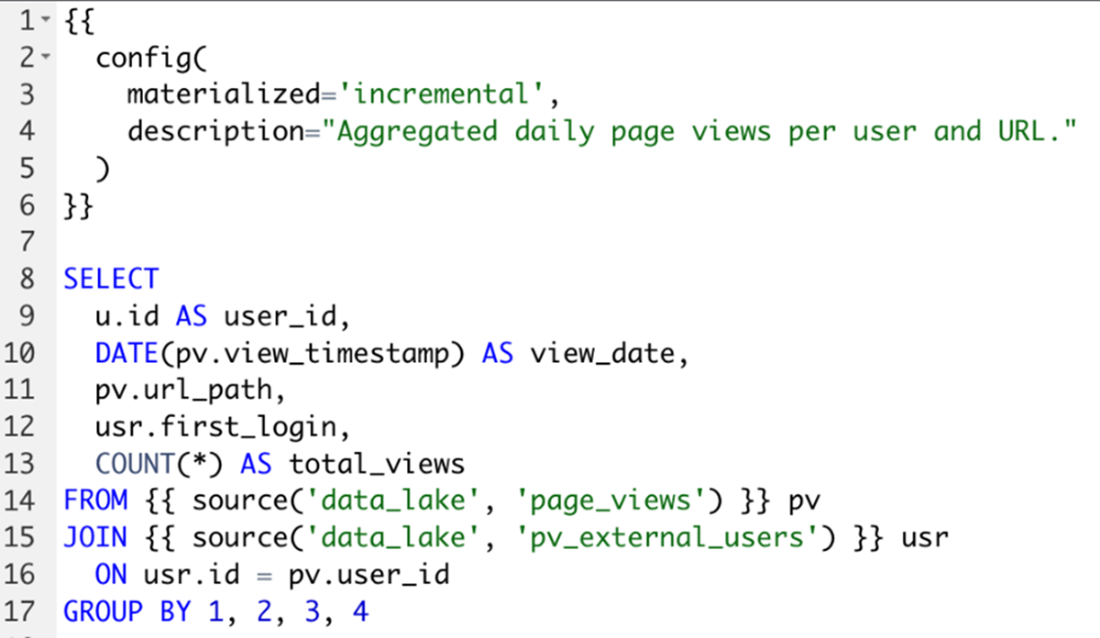
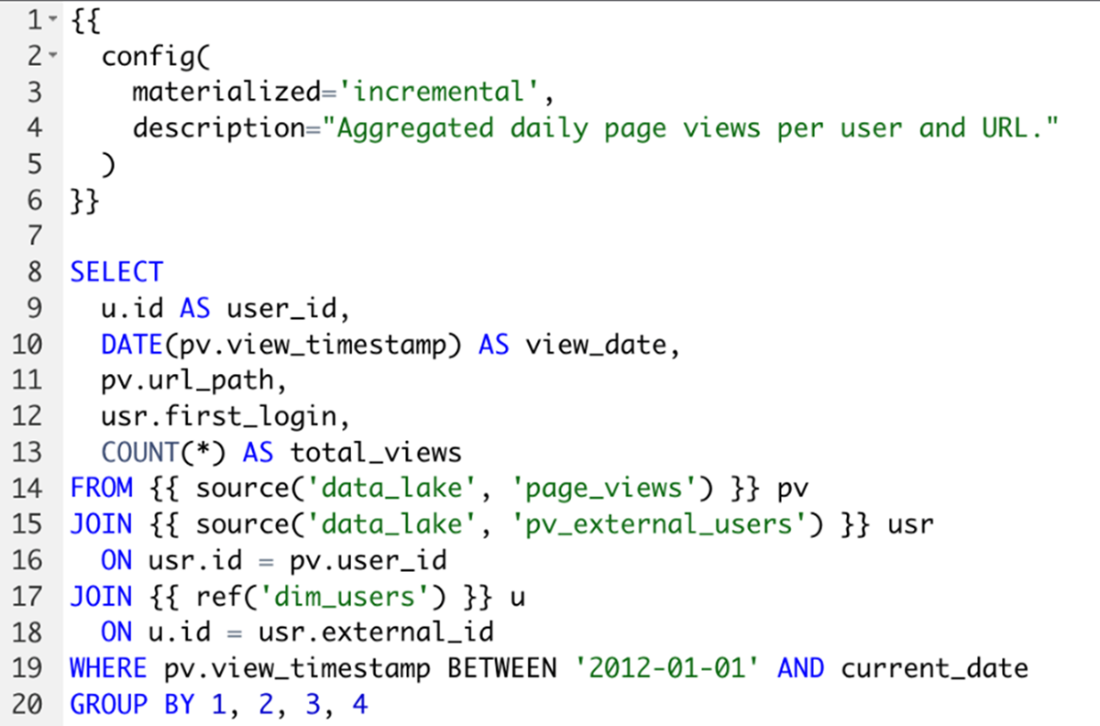
dbt combines SQL, table metadata, and Jinja templating syntax to define tables.
Data without quality checks can be challenging to use and generate insights with.
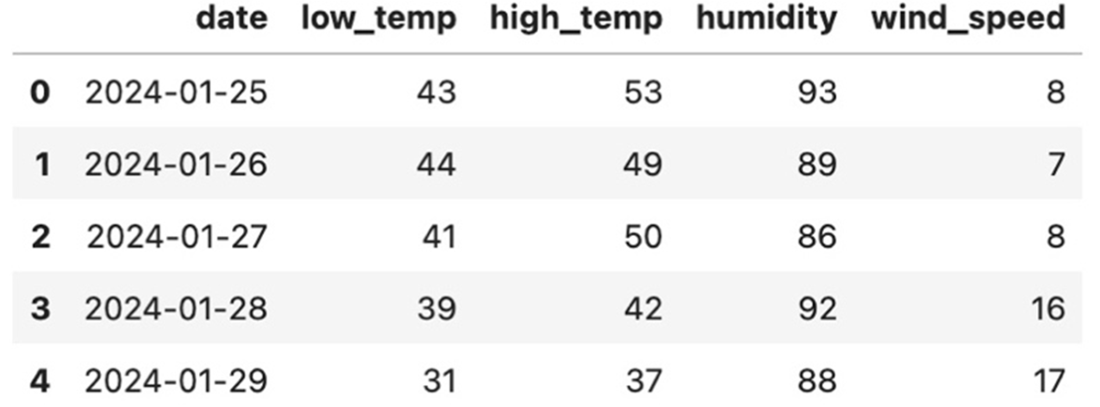
Structured daily forecast data retrieved from the National Weather Service API.
A date filter and inner join to the application’s users table can remove several issues that may arise with this data source.
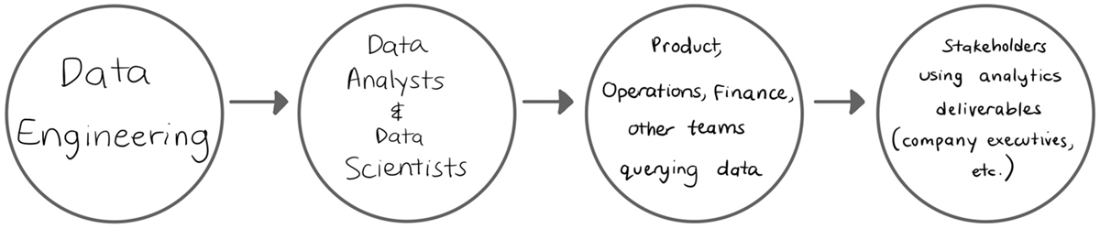
Data teams typically have cascading stakeholders that use increasingly curated information.
Information schemas contain metadata about the information in a data warehouse.
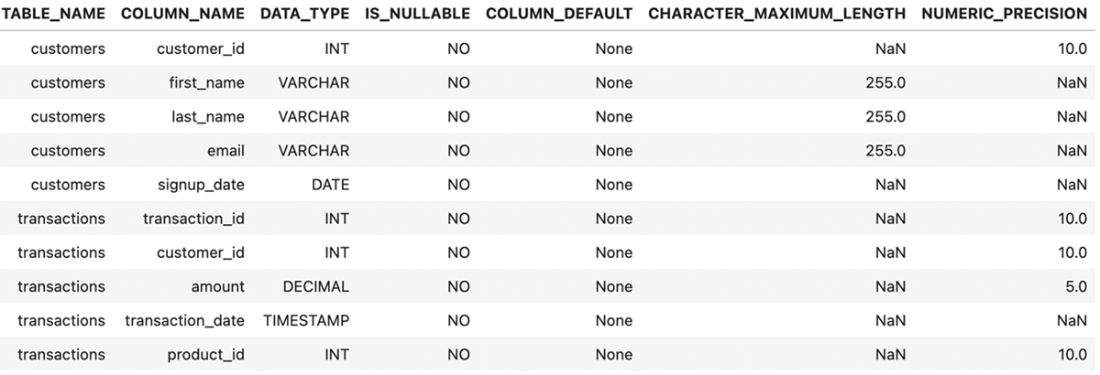
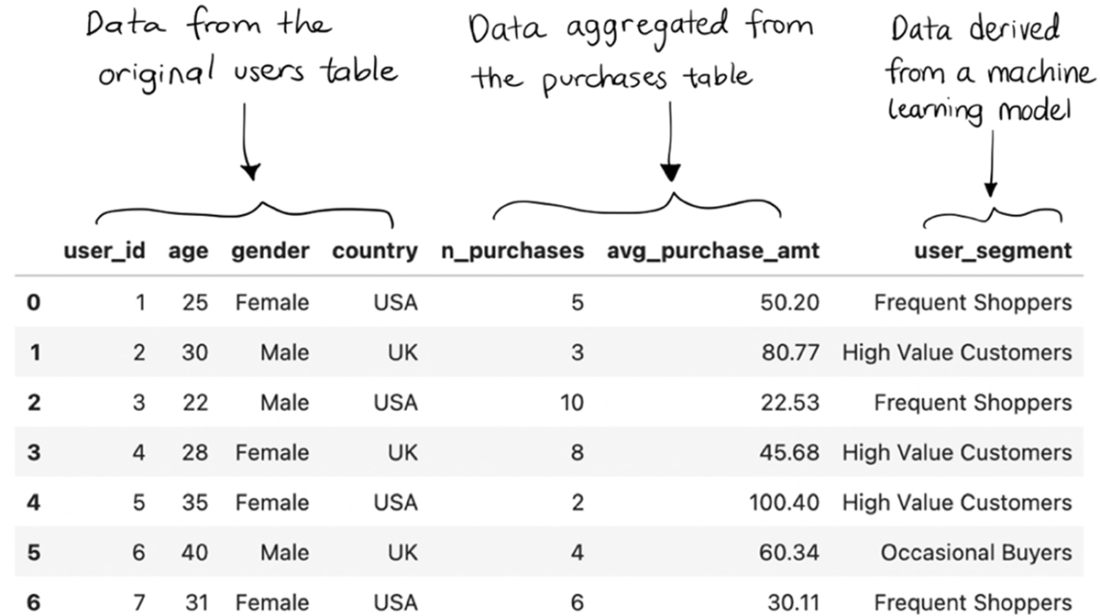
Creating tables in analytics schemas involves synthesizing and aggregating multiple sources into one place to reduce time, effort, and inaccuracies when leveraging data.
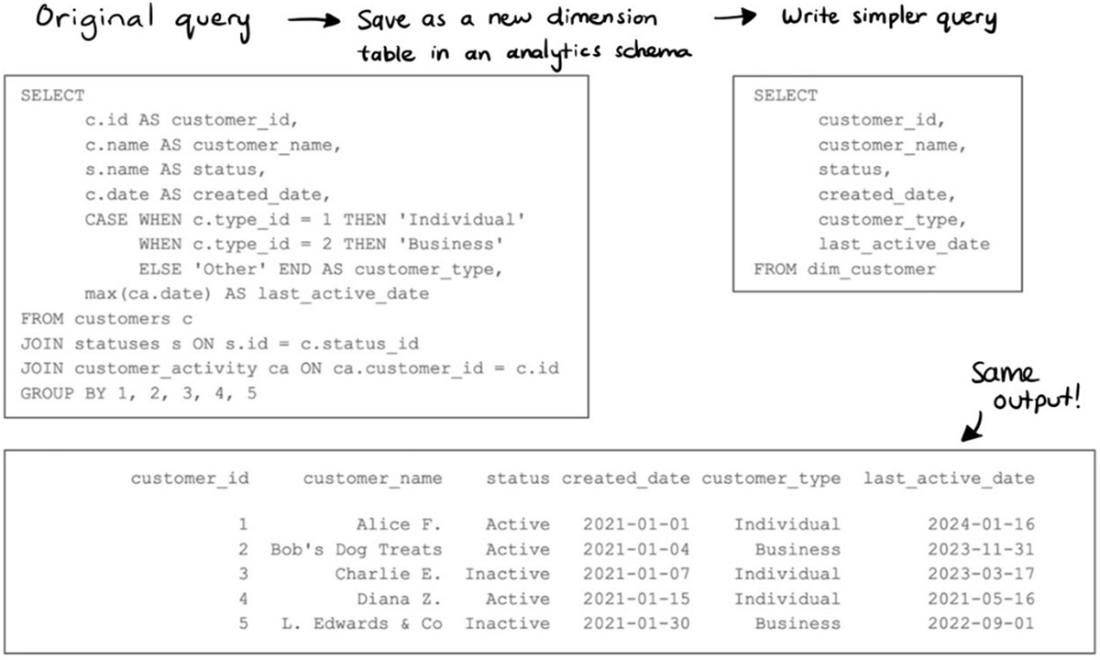
Analytics engineering takes the complex queries necessary to handle the nuances of an organization’s data and codes them into curated models for analysis.
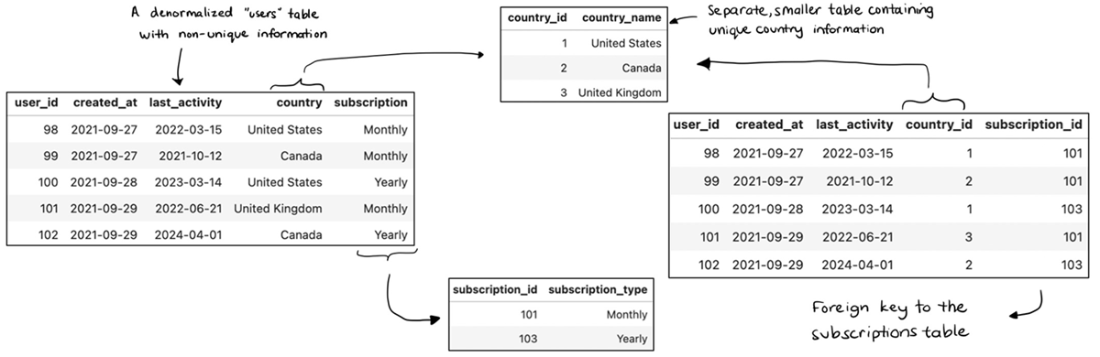
As the record of users continues to grow, the subscriptions and countries tables remain small, and the foreign key integers on the normalized table cost less to store than full names.
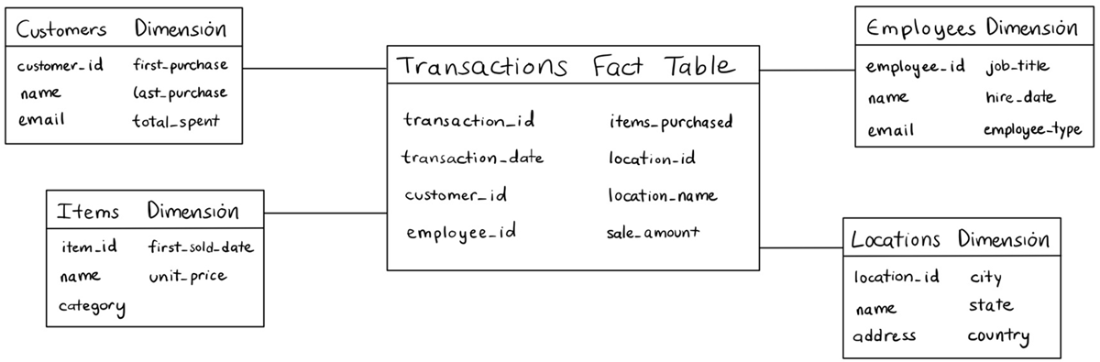
Star schemas have fact tables at the center connected to dimensions with related attributes.
Summary
- The quality and accessibility of data at an organization enables analysts to quickly and confidently generate insights for their stakeholders.
- An organization’s data infrastructure consists of the tools and frameworks used to gather data from various sources, combine it into one destination for storage, structure it for its use cases, and retrieve it for analysis.
- A data warehouse is a centralized repository for storing, managing, and analyzing structured data from various sources. It's crucial for business intelligence and analytics, providing a coherent, consolidated view of data across an organization to support decision-making.
- Document databases offer flexible, schema-less storage for data structured in a document format. These databases are ideal for semi-structured and nested data (e.g., JSON documents). As such, they’re often used for managing content that doesn’t neatly fit into a structured tabular format.
- ETL (Extract, Transform, Load) refers to the process of extracting data from different sources, transforming it into a structured format, and loading it into a target storage system, such as a data warehouse. This process ensures that data is clean, consistent, and ready for analysis before it’s saved in the target system.
- ELT (Extract, Load, Transform) is a variation of ETL where the data is extracted, loaded directly into the target system, and then transformed. It leverages the computational power of your data warehouse for structuring and transformation, offering a flexible approach when working with data sources used for multiple purposes.
- Data lakes are storage repositories designed to hold vast amounts of raw data in structured or unstructured source formats. These raw data sources are then structured, transformed, and surfaced in a data warehouse as needed for analysis.
- Big data are datasets too large or complex to be handled by traditional data processing strategies. Instead, working with these data sources necessitates using distributed computing frameworks to process and analyze them effectively.
- Distributed computing frameworks are designed to divide the process and analyze large volumes of datasets into chunks of work performed in parallel across clusters of computers. These tools are essential for big data analytics workloads.
- Data management refers to all the practices and processes in place at an organization to handle data structuring, quality, security, governance, and more. Effective data management strategies ensure that organizations can confidently and appropriately use their data for decision-making.
- Structuring data involves organizing and formatting it to make it easily accessible, analyzable, and usable for specific purposes.
- Data quality refers to the accuracy, completeness, consistency, and timeliness of data sources used for analysis. High quality requires data teams to monitor, test, and correct for inaccuracies to ensure it reliably serves its intended purpose.
- Data testing is the process of verifying the accuracy of the data captured throughout the pipeline. It involves executing tests against data for issues such as duplicate records, missing values, or other discrepancies and errors, ensuring it meets specified requirements and quality standards.
- Metadata is detailed information about the properties of your data—the available schemas, tables, columns, their data types, and more. This information can guide users in discovering the data resources they need and how to use them.
- The field of analytics engineering emerged to sit at the intersection of data engineering and analytics, focusing on delivering high quality data structured for analytics at scale.
- Star schemas are sets of tables centered around a fact, or business event, with one or more dimensions connected to it that describe the various attributes related to the event. These schemas are designed to align with the organization’s key processes.
- Fact tables capture numeric information about business events or actions—transactions, clicks, page views, etc. Fact tables are created about the most relevant data to the business or organization for analysis.
- Dimension tables capture information about business entities—customers, users, employees, etc. Dimensions contain a range of properties about the entities combined from multiple tables, derived, or aggregated to provide a high-level picture of the entity.

 Effective Data Analysis ebook for free
