2 Mapping physical systems to a digital representation
Building an effective digital twin starts by deciding what parts of the physical world to represent and how precisely to represent them, guided by clear business objectives rather than technology-first enthusiasm. The chapter emphasizes an objective-driven workflow: identify concrete problems and opportunities, define leading and lagging indicators with baselines and targets, map how decisions will improve, and then specify the minimum viable digital representation that supports those decisions. This approach prevents over-engineering, ensures each modeled attribute has a purpose, and provides measurable criteria to validate value—illustrated through examples such as shifting from time-based to predictive maintenance and optimizing home energy and water use.
To build the representation, start with information you already have and transform it into machine-readable data. Historical records (like maintenance logs and utility bills) can be digitized with OCR to create long-term baselines; photographs provide visual context, embedded metadata, and can be processed with computer vision to extract structured readings; video adds temporal continuity and can be made efficient via change detection and edge processing; engineering documents (such as process and instrumentation diagrams) encode topology and intent that can be extracted with computer vision and multimodal models; and external systems (e.g., operational systems or weather services) supply contextual signals for prediction and optimization. The throughline is to convert heterogeneous, often legacy sources into structured, historized data that keeps the twin synchronized with reality and directly supports better, faster decisions.
Because location and geometry anchor understanding, the chapter outlines spatial models and reference systems. It covers 2D representations (maps, floorplans, blueprints, engineering drawings) for clarity, measurement, and planning; 3D options (BIM/IFC for rich semantics, meshes for scalable visualization, parametric CAD for design intent and constraints, and point clouds for high-precision as-built capture), plus voxel-based models for internal structures. It then explains how to relate these assets in space using local, geographic, geocentric, and projected coordinate systems, and how to perform coordinate transformations so data lines up consistently. Finally, it offers a pragmatic selection framework: map each potential source to objectives, assess accuracy and integration effort, prioritize high-value/low-effort items first, and incrementally expand fidelity only when it unlocks new, validated decisions.
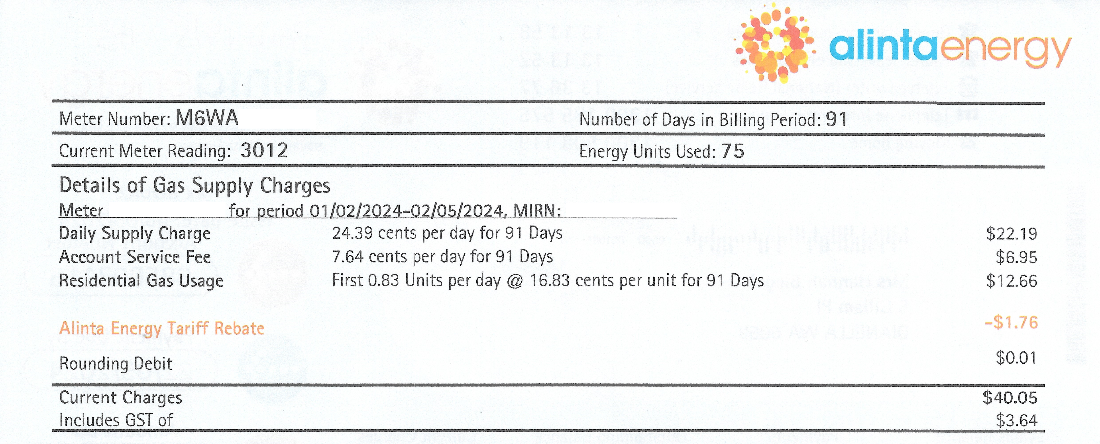
A sample gas bill as generated quarterly by my residential gas provider. The current meter reading is provided for a stated date.
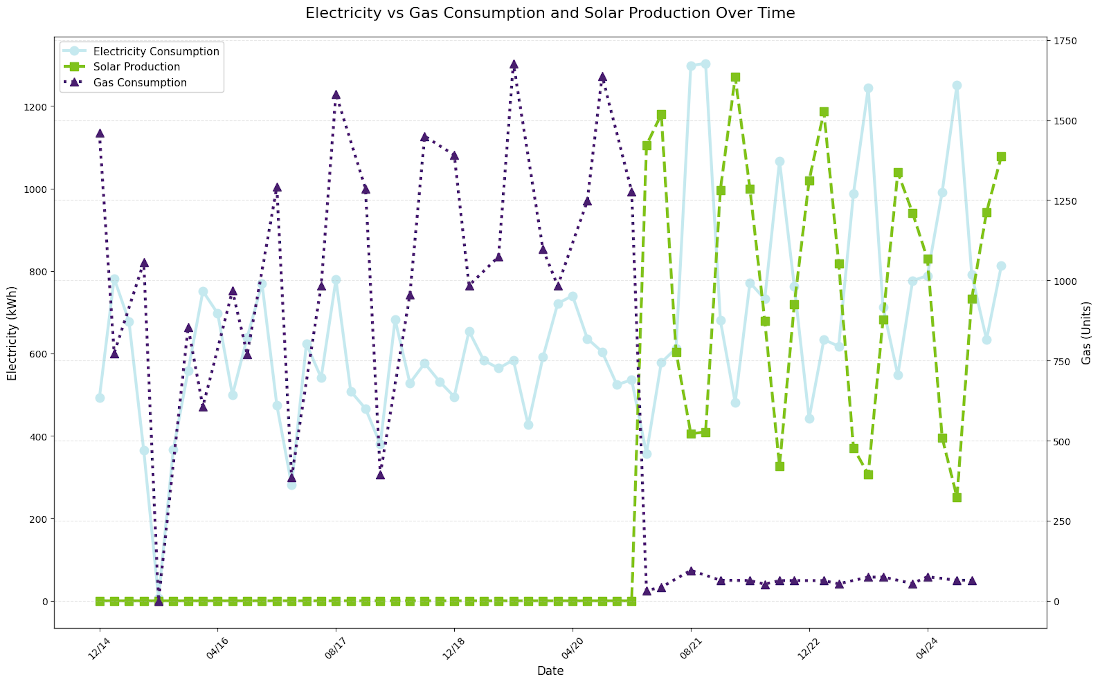
Ten years' worth of energy consumption data extracted from PDF gas and electricity bills by OCR.
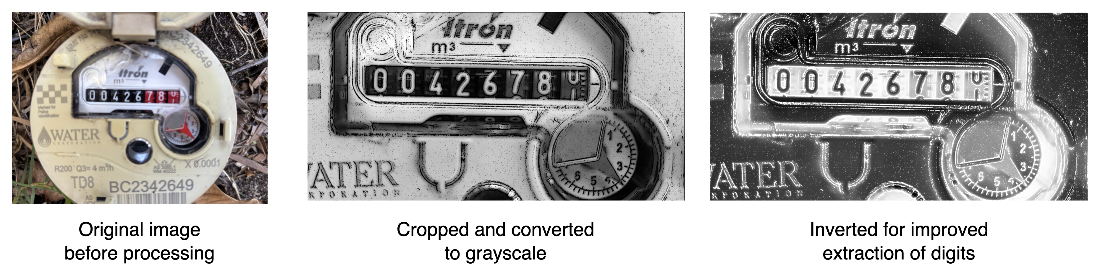
A photograph of my residential water meter (1), with the area of interest extracted and converted to grayscale in (2) before being inverted in (3) to enable OCR extraction of the digits.
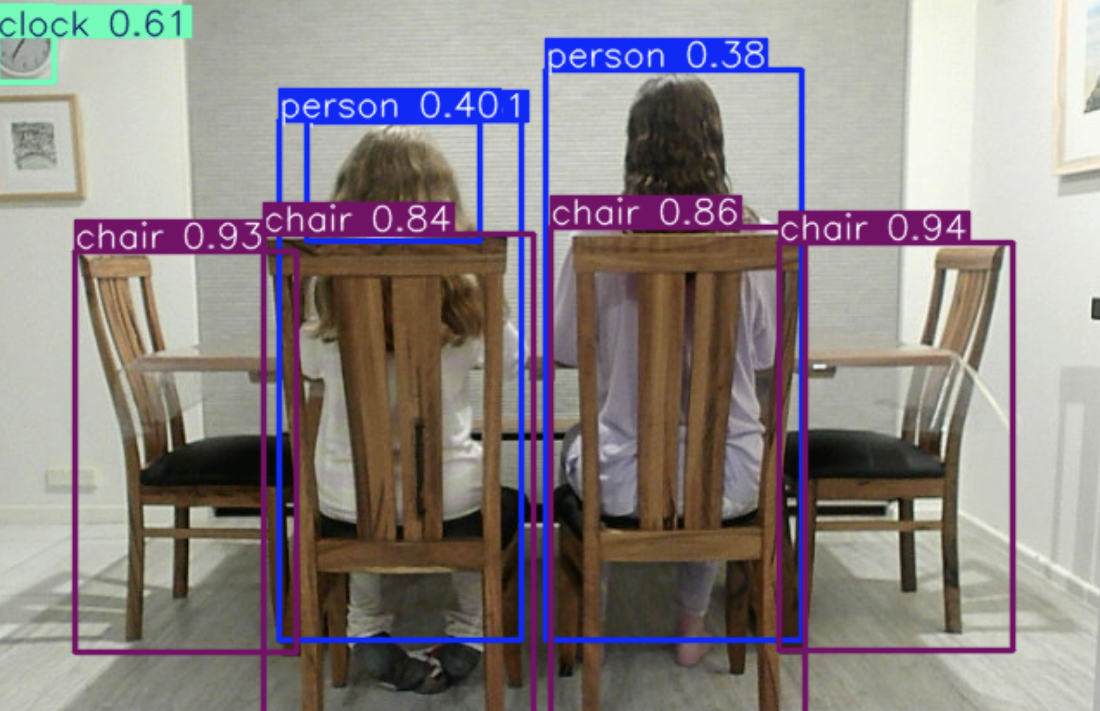
An example of using a multi object-detection computer vision model over a video stream using the YOLO v8 model to determine room occupancy. The model draws a bounding box around each object it detects in the stream, and adds a label to the box with a confidence score, which is a combined percentage representing the model’s certainty that a detected object belongs to a specific class and that the bounding box contains an object.
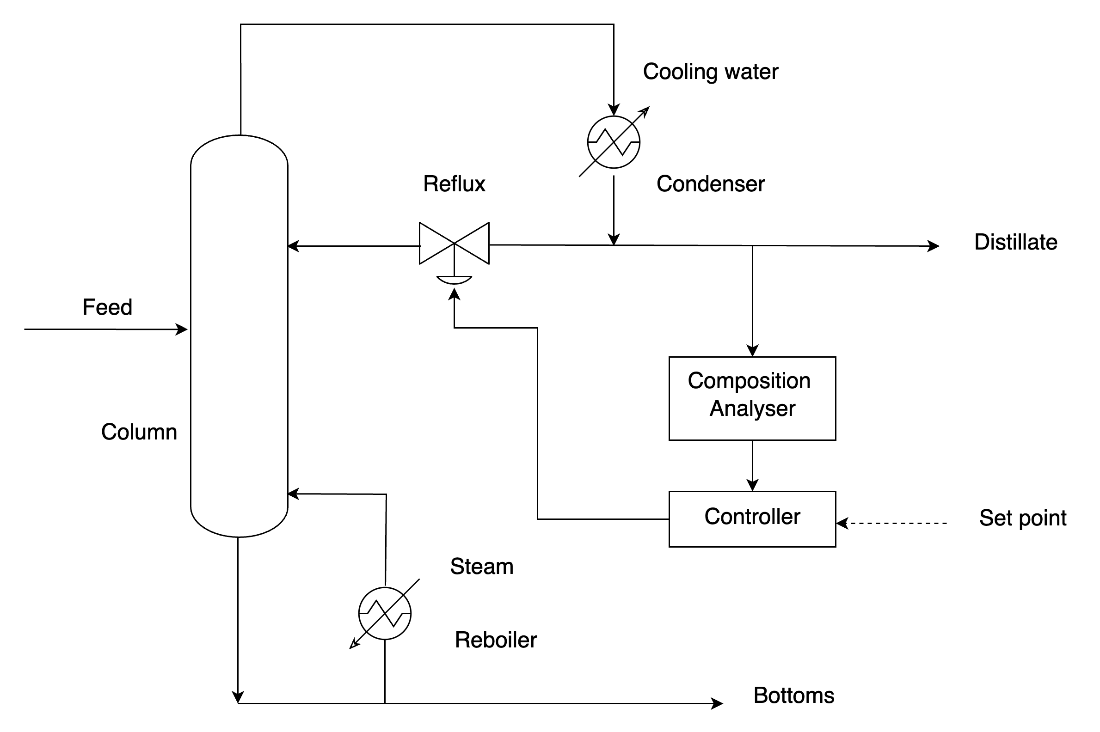
A simple example of a process flow diagram (PFD) showing the components of a chemical process using standard symbols to represent physical components and their relationships.
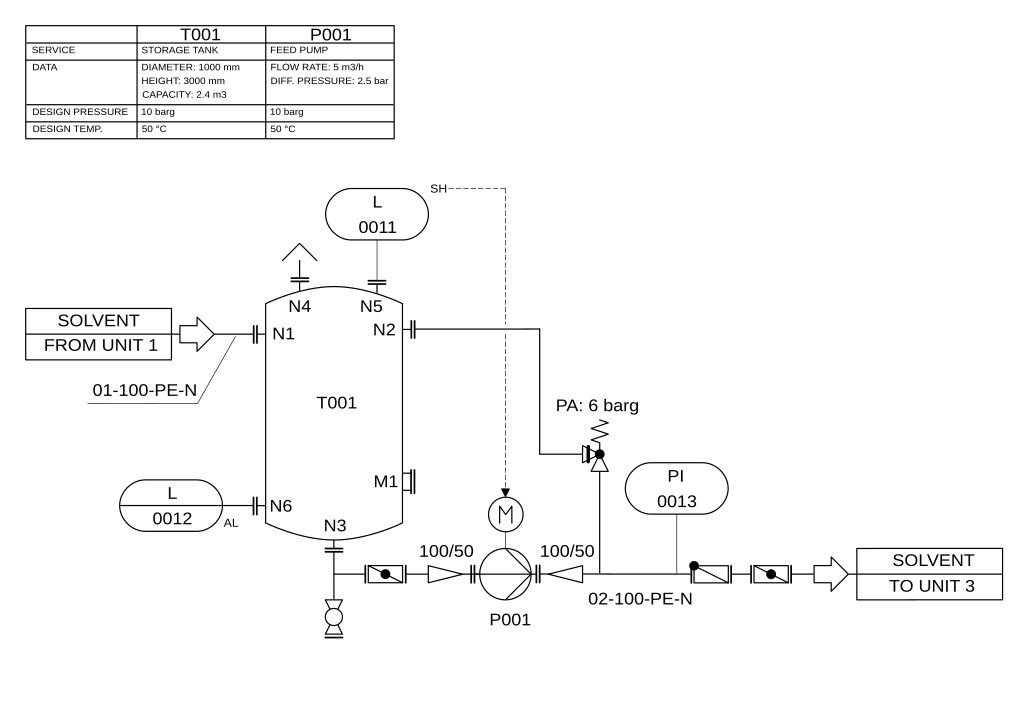
A sample piping and instrumentation (PID) diagram showing how complex physical systems can be logically represented in a diagram. Source Wikipedia. Licensed under CC BY-SA 3.0
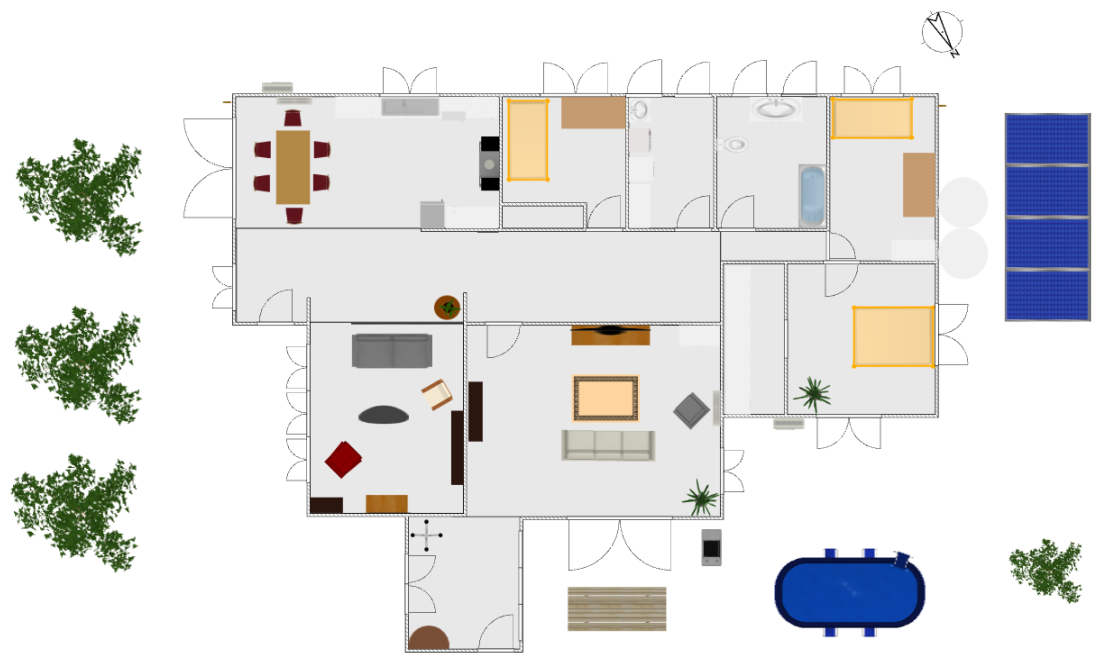
A floorplan of my home that I will use in my digital twin to map sensor placement, and as the basis to build a 3D model of the building.
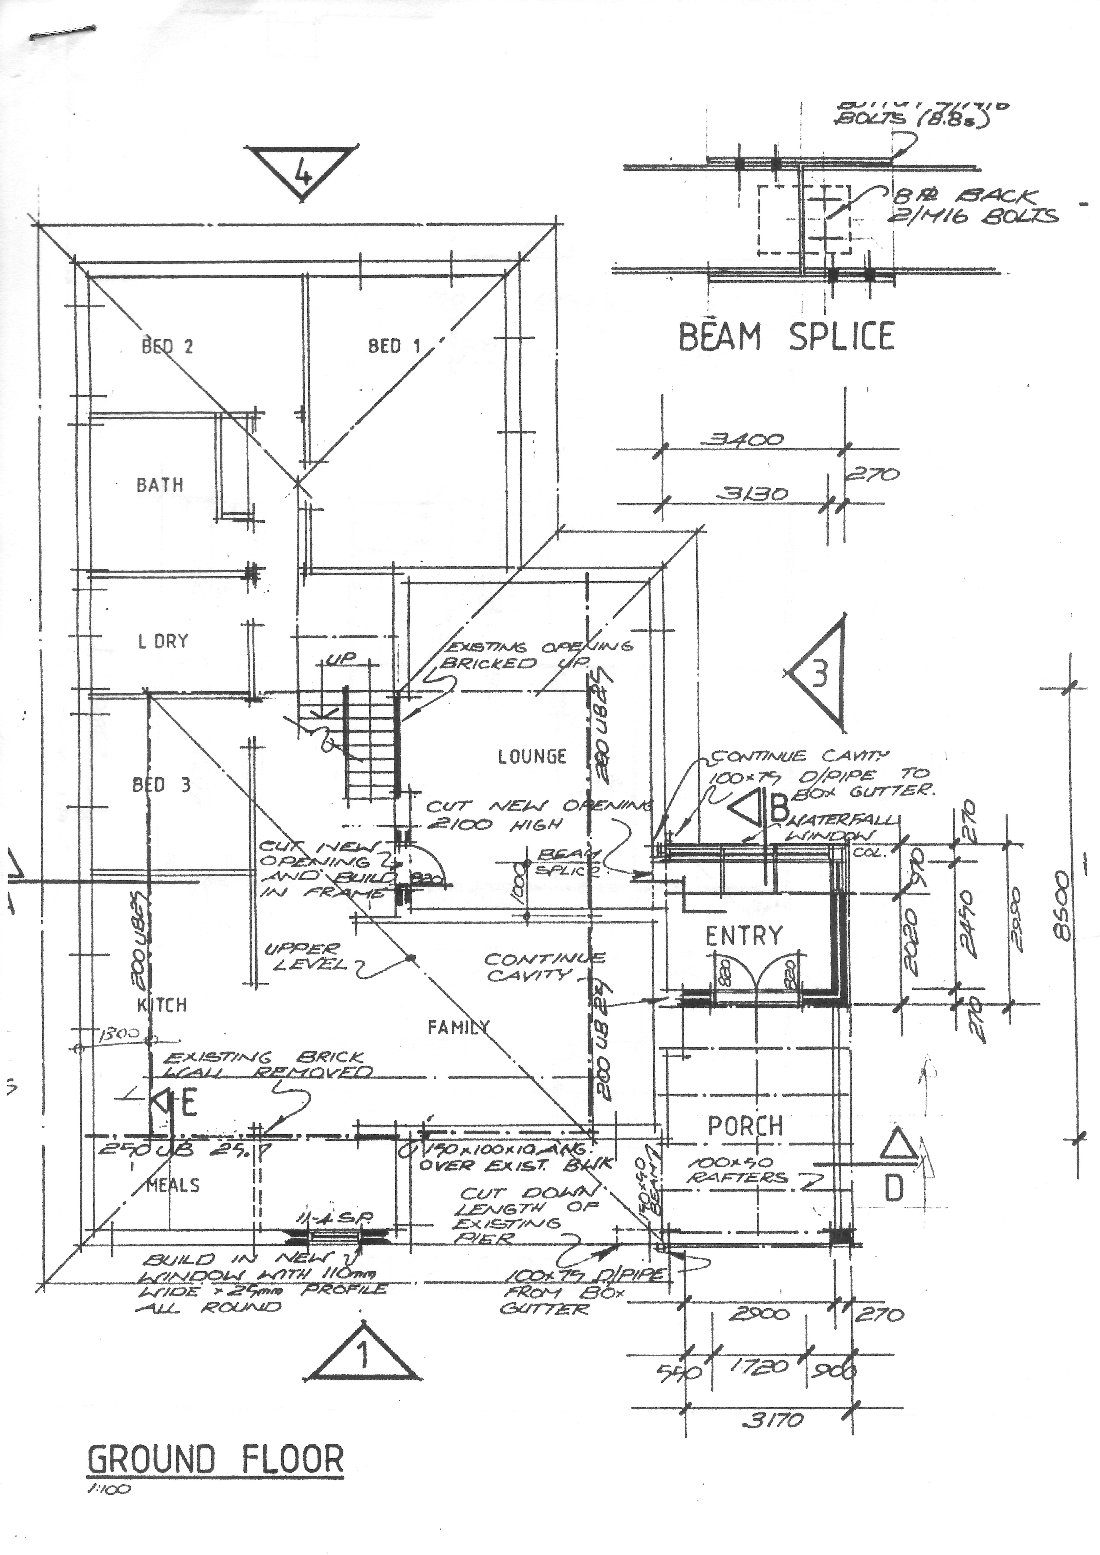
An example of a blueprint of my home, showing dimensions and material specifications that are an important source of spatial information when modelling physical structures digitally.
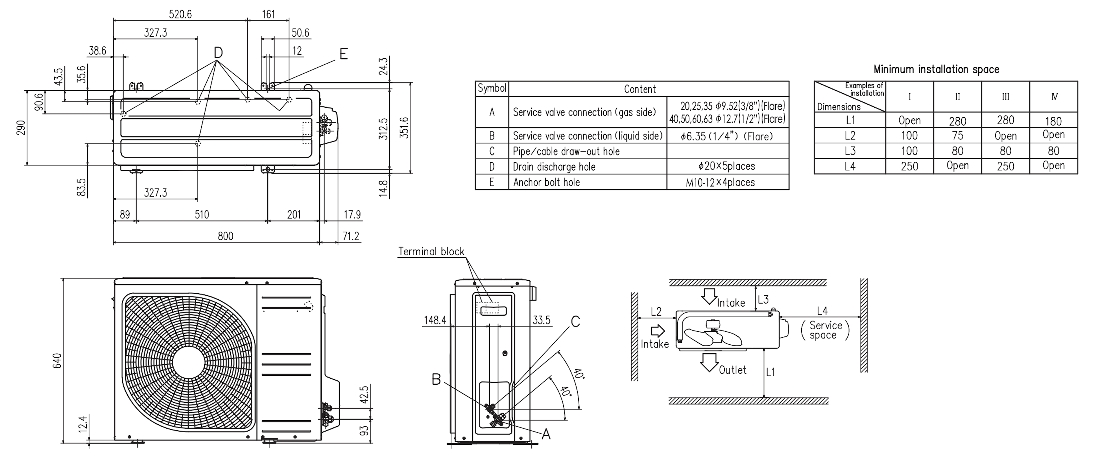
An engineering drawing of an external reverse cycle air conditioning unit. © Mitsubishi Heavy Industries.
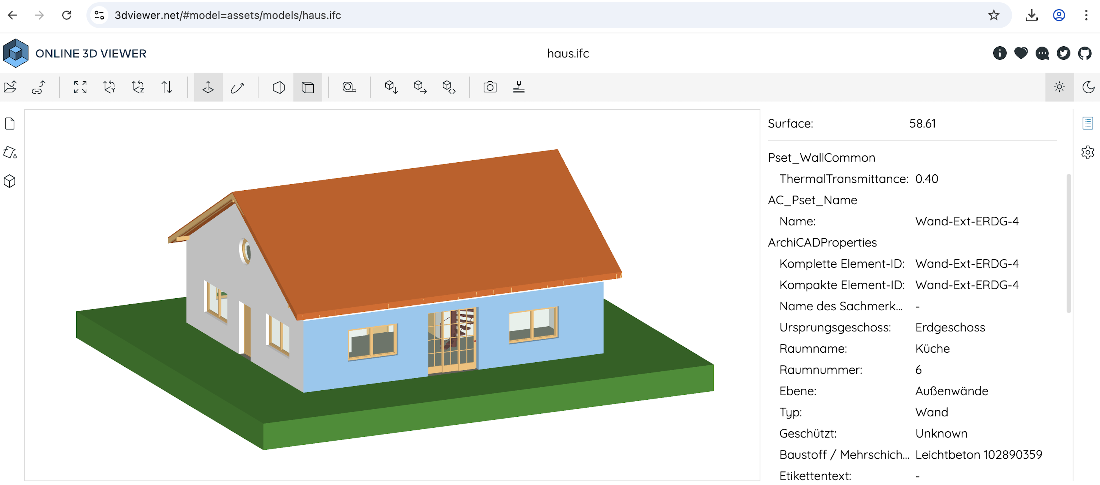
An example of a BIM model in IFC showing the 3D model and additional information stored within it. © Viktor Kovacs. Data licensed under MIT.
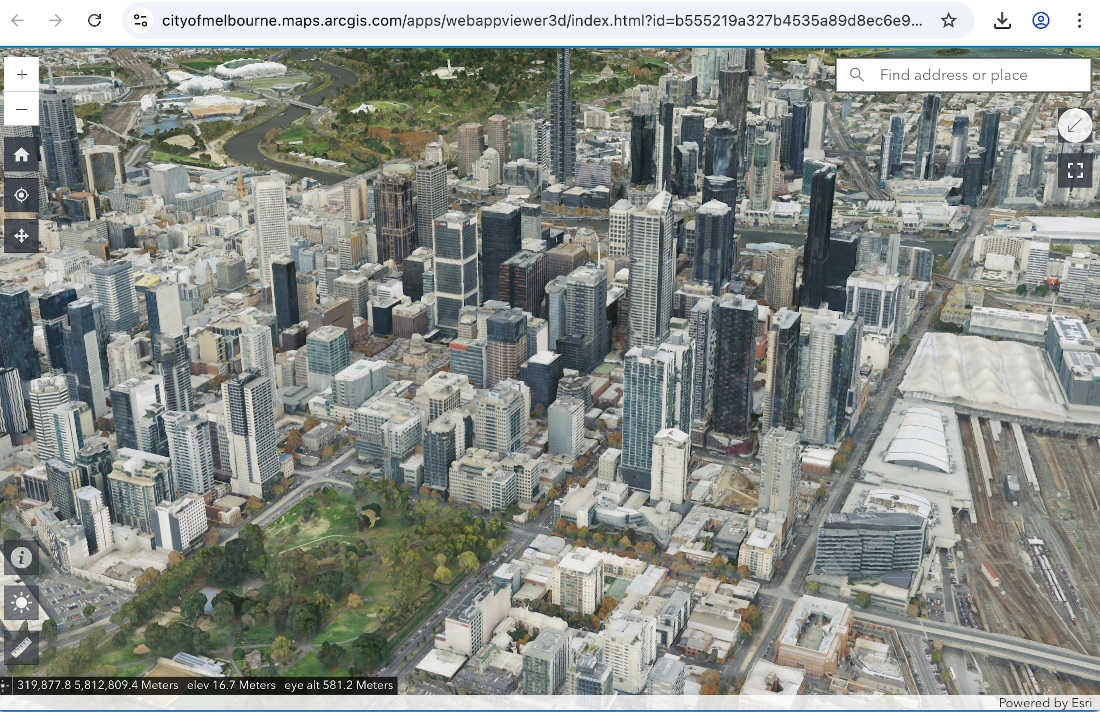
A mesh-based 3D model of the city of Melbourne illustrating an efficient digital representation of a large physical environment. Data © City of Melbourne. Licensed under CC BY 4.0
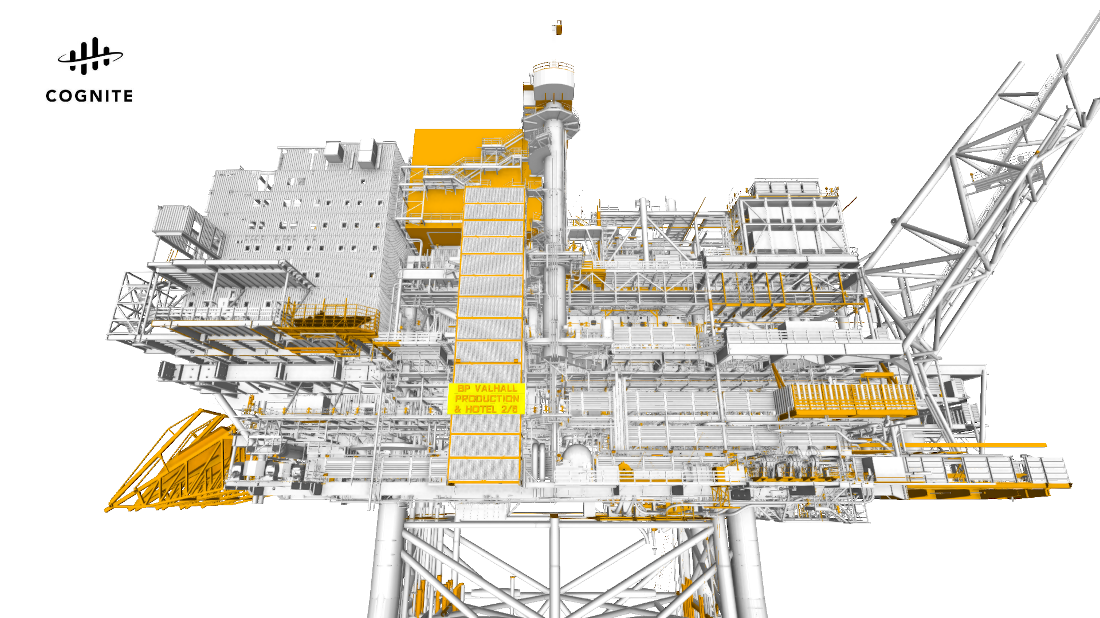
A 3D model derived from a CAD model of the Valhall production platform—a complex industrial facility located in the North Sea—as pictured in Cognite Data Fusion™, an industrial digital twin platform. Image © Cognite™ ( https://www.cognite.com/en), reproduced with permission.
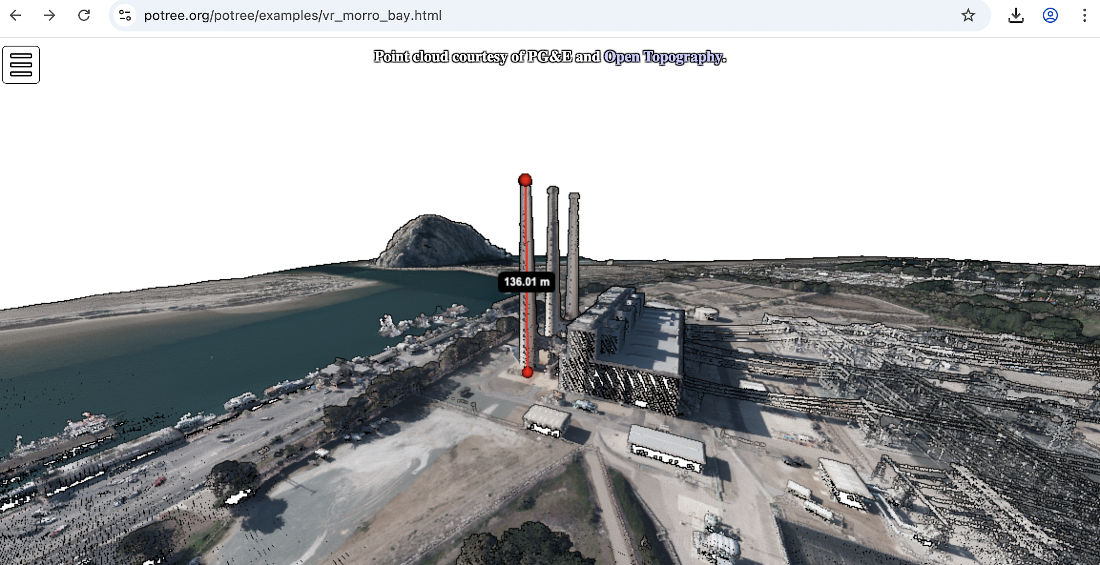
A point cloud visualization of the Morro Bay power station, showing how measurements can be taken within the point cloud. © PG&E Diablo Canyon Power Plant (DCPP): San Simeon and Cambria Faults, CA. Distributed by OpenTopography. https://doi.org/10.5069/G9CN71V5
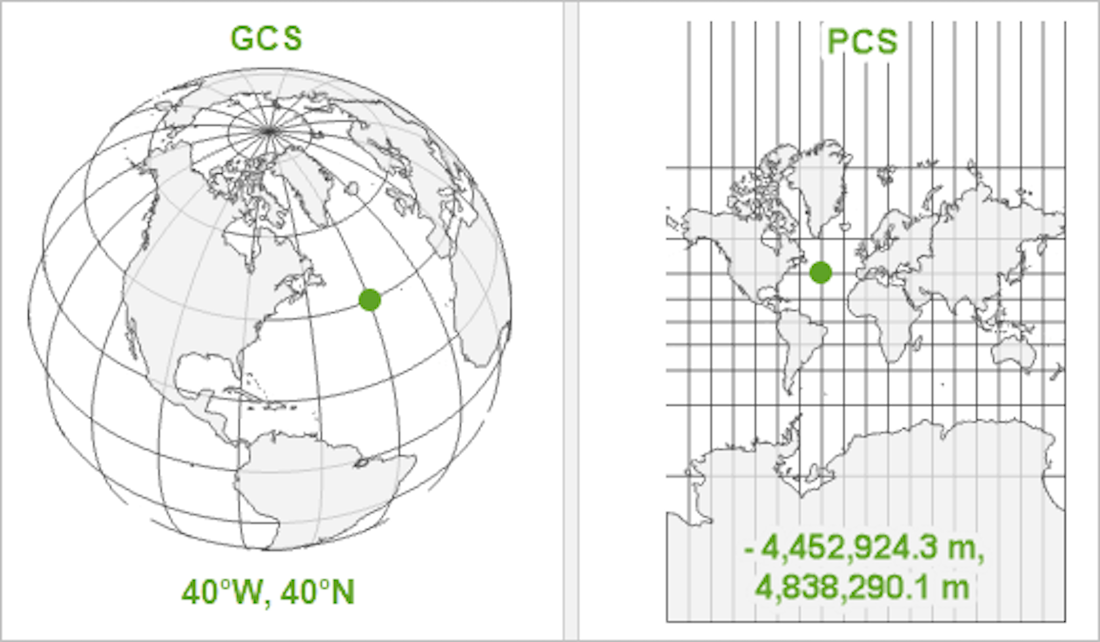
An example of the same point represented in a geographic coordinate system and a projected coordinate system. Copyright © 2025 Esri and its licensors. All rights reserved.
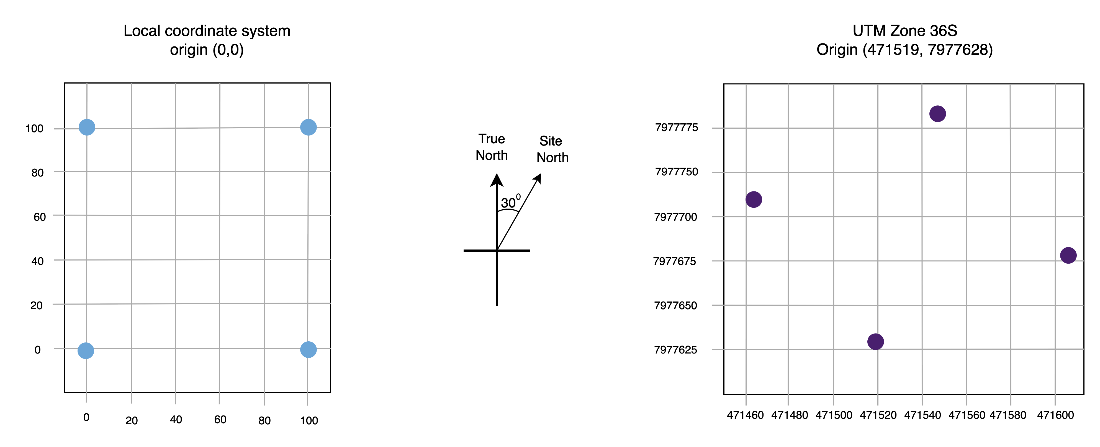
Visualization of the output of the code in listing 2.8 that converts local coordinates to UTM coordinates in zone 36S (EPSG:32736) with an origin point at 471519, 7977628 and a site offset of 30 degrees from true North.
Summary
- When building a digital twin and looking to capture physical systems for digital representation, start with objectives, not technology. Define specific, measurable business outcomes before deciding how to capture physical systems for digital representation, and at what level of fidelity.
- Historical documentation that captures designs, drawings, and the state of systems can hold critical data that can be extracted into a machine readable format using OCR and computer vision, providing the temporal context essential for predictive digital twins.
- Photographs and videos are an important data source when representing physical systems, both as representations of the physical environment at a point in time and as a source to build more complex 3D models or extract information from.
- Three main 3D representation approaches serve complementary purposes: mesh-based models provide efficient visualization for web browsers, parametric models enable precise engineering and design iteration, and point clouds capture complex geometries and track physical changes over time.
- Understanding coordinate systems (local, geographic, projected) and transformation techniques ensures that diverse data sources from GPS tracking to CAD drawings can work together seamlessly.
- Match representation fidelity to decision requirements and start with the minimal possible representation of the physical world in your digital twin. Prioritize what aspects of the physical environment you will capture to support your objectives.
FAQ
Why should a digital twin project start with objectives instead of technology?
Beginning with clear business objectives ensures you capture only what’s needed to make better decisions and deliver measurable value. It prevents investing in impressive sensors or 3D visuals that don’t reduce downtime, costs, or risk. Objectives anchor scope, fidelity, data needs, success metrics, and validation throughout the lifecycle.How do I decide what to digitize and at what level of fidelity?
Work backward from the decisions you want to improve. For each decision, list the minimum data required, the timeliness needed, and the acceptable accuracy. Balance fidelity against cost, latency, and maintainability. Start simple, validate impact, then iterate to add detail only if it improves outcomes.What are leading and lagging indicators, and how do I set baselines and targets?
Leading indicators are early signals (for example, vibration trends, meter read deltas, occupancy) that help anticipate outcomes. Lagging indicators are business results (for example, downtime, energy/water spend). Establish a baseline for both, define targets and alert thresholds, and choose update frequencies that match the decision cadence.What is a “minimum viable digital representation” (MVDR)?
An MVDR is the smallest set of attributes, behaviors, and relationships needed to enable your target decisions. Examples: for predictive pump maintenance, you might capture vibration spectra, bearing temperatures, motor current signatures, and usage. For a home twin aimed at utility savings, you might track electricity use, water meter reads, solar output, and occupancy.Which information sources can I use before buying new sensors?
Start with what you already have: historical records (maintenance logs, incident reports, utility bills), photographs (often with GPS metadata), videos, engineering documents (PFDs, P&IDs, blueprints), and external systems (for example, ERP/SCADA, weather and utility portals). These provide rich, low-cost context and history.How do I digitize unstructured records like PDFs and photos?
Use OCR to extract text and numbers from scanned bills and reports; simple preprocessing (crop, grayscale, invert) improves accuracy. For analog meters, photograph the dial and apply OCR. For richer visuals, run object detection on images/video to detect events (for example, room occupancy). Always validate and store results with timestamps and provenance.When should I stream video, use change detection, or process at the edge?
- Continuous streaming: maximum context, highest bandwidth/storage cost.- Change/event detection: transmit only when something meaningful changes.
- Edge processing: analyze locally and send compact results (for example, “3 people detected”). Most twins benefit from edge-first designs for cost, latency, and privacy.
How do engineering documents (PFDs, P&IDs, blueprints) fit into a twin?
They encode structure, topology, instrument IDs, and design intent. Use them to build accurate digital models and to contextualize other data. Vision-capable models can help extract symbols, connectivity, and properties into structured formats (for example, JSON) for search, linking, and analysis.What spatial models should I consider (2D vs 3D), and when?
- 2D: maps and floorplans for navigation, planning, sensor placement, and efficient computation.- BIM/IFC: rich 3D semantics (materials, systems) for operations and coordination.
- Meshes: fast, scalable visualization of large environments.
- Parametric/CAD: precise design intent, constraints, and simulation.
- Point clouds: survey-grade reality capture and measurement; good for change detection.
- Voxels/CT: volumetric/internal structure where surface geometry is insufficient.

 Digital Twins in Action ebook for free
