7 The Observability Service: seeing what your AI does
AI systems need observability that goes beyond standard uptime and latency monitoring, because a system can look healthy infrastructure-wise while still producing wrong, unhelpful, or overly expensive outputs. The chapter frames observability as the way to answer the core operational questions of what happened, how long it took, how much it cost, and how good it was. It also distinguishes observability from experimentation: observability is passive and records reality, while experimentation is active and tests whether changes improve that reality.
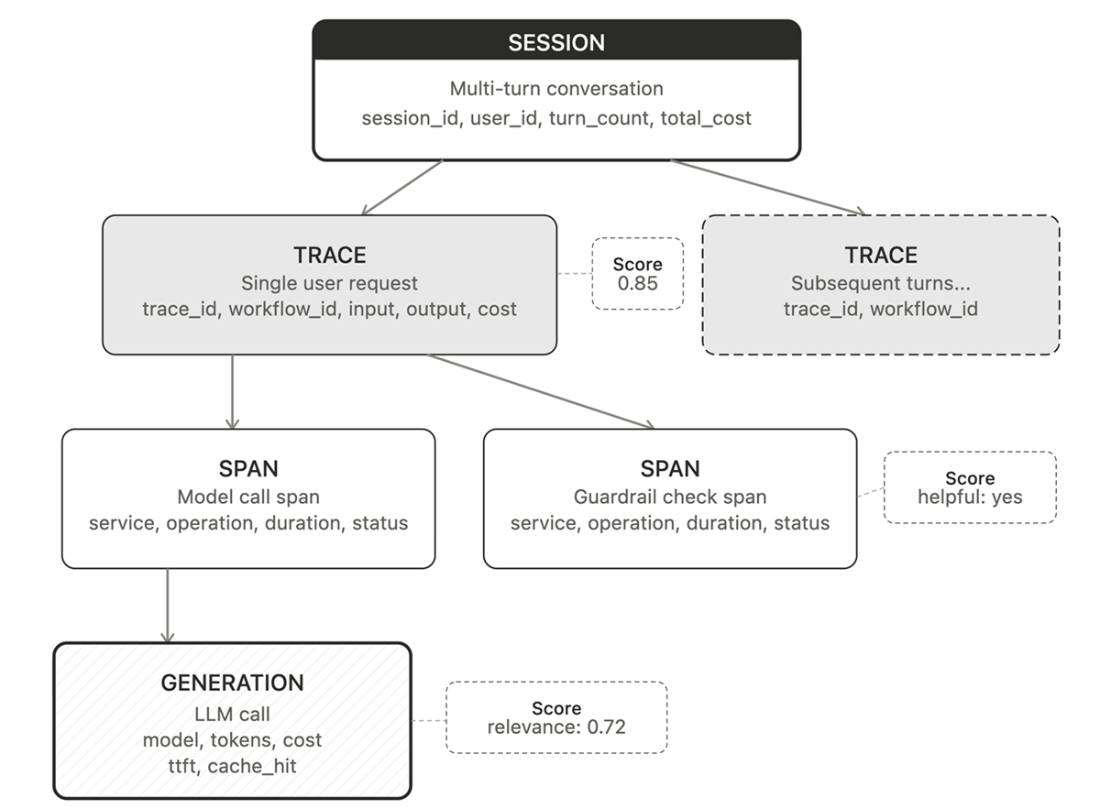
The chapter’s central data model is built around five primitives: sessions, traces, spans, generations, and scores. Sessions group multi-turn conversations, traces represent single user requests, spans capture units of work within a trace, and generations are specialized spans for LLM calls with model-specific fields like token counts, cost, and time to first token. Scores attach quality signals to traces, spans, or generations and can come from automated checks, model judges, or human reviewers. Structured logs and aggregate metrics complement this request-level model by adding detailed event records and system-wide trends.
To support this model, the Observability Service exposes separate ingestion and query operations for logs, metrics, traces, generations, scores, cost reporting, budget alerts, and platform health. Platform services automatically create telemetry through a shared tracing base class and domain-specific metric publishers, while an observability client batches and buffers data so telemetry never slows down user-facing requests. The practical result is a debugging workflow that starts with traces to find the bottleneck, drills into logs to explain the cause, and checks metrics to see whether the issue is isolated or systemic, all while also enabling quality analysis and cost control at scale.
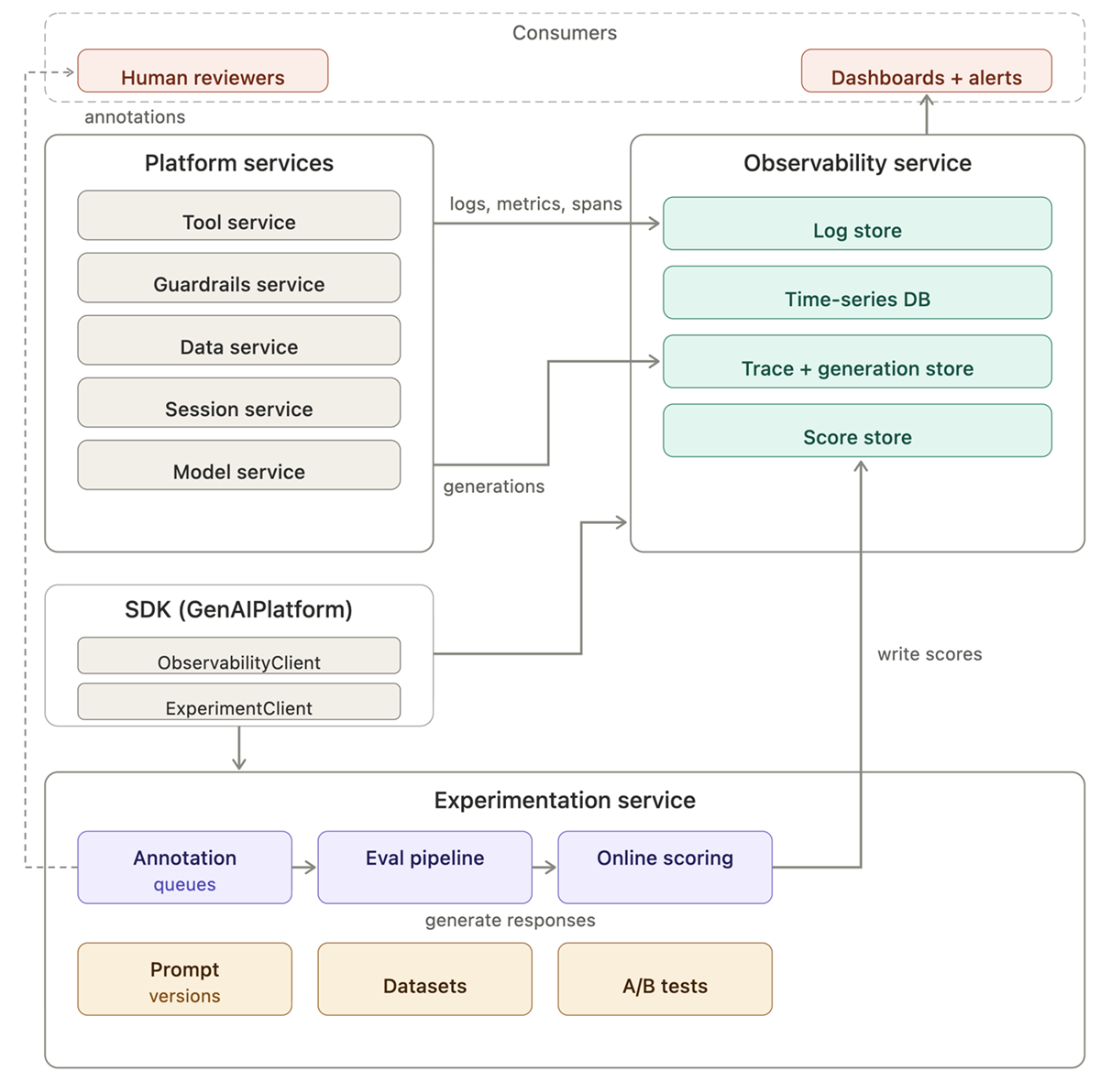
Observability and experimentation architecture, spanning this chapter and the next. Platform services (left) emit logs, metrics, spans, and generations into the Observability Service (right), which routes them to four specialized stores. The SDK's ObservabilityClient buffers and flushes telemetry from developer workflow code. Dashboards and alerts consume traces, metrics, and scores. The Experimentation Service (bottom, built in the next chapter) evaluates production traces and writes the resulting quality scores back to the Score store.
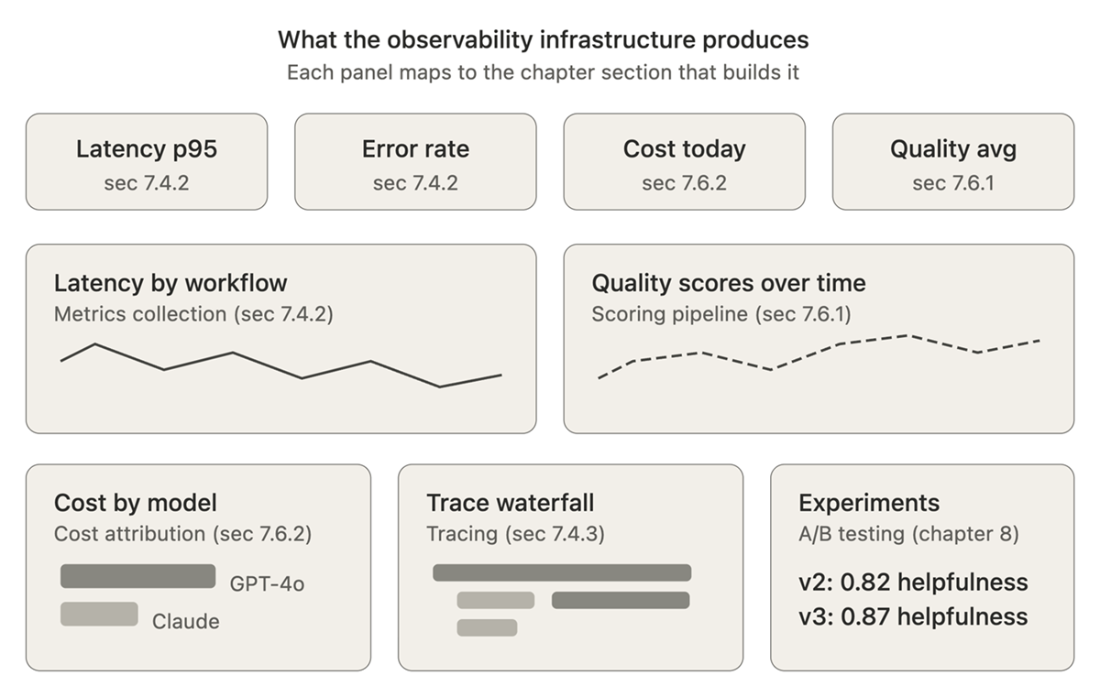
The dashboard that this chapter's infrastructure makes possible. Each panel names the section that builds it: latency and error rates come from metrics collection (section 7.4.2), the trace waterfall from distributed tracing (section 7.4.3), quality trends from scoring (section 7.6.1), and cost breakdowns from cost attribution (section 7.6.2). The Experiments panel comes from the A/B testing we build in the next chapter.
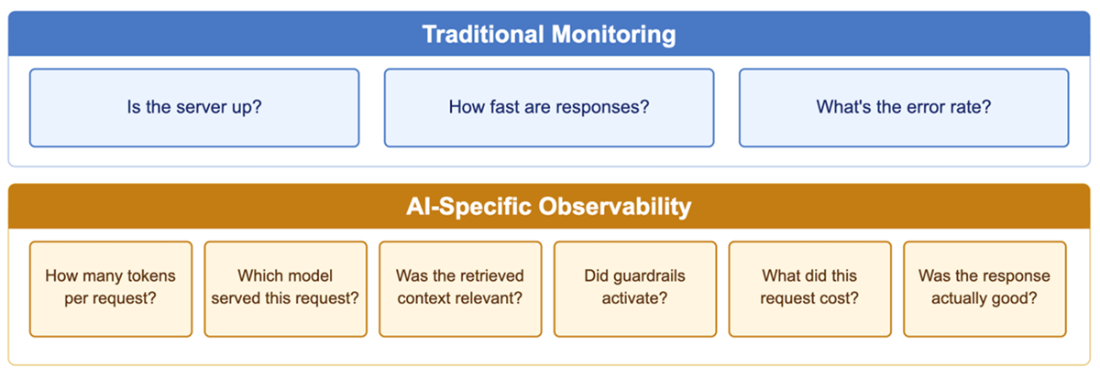
AI observability extends traditional monitoring with dimensions unique to AI systems. Traditional metrics (uptime, latency, errors) still matter but miss the questions that AI operations teams need answered. Token tracking, model selection visibility, retrieval quality, safety evaluations, cost attribution, and response quality scoring are all AI-specific concerns that the platform must capture.
The observability data model hierarchy. Sessions group related traces (a multi-turn conversation). Each trace represents a single user request flowing through the platform. Traces contain spans (units of work in a service) which can nest. Generations are a specialized span type for LLM calls, carrying model-specific attributes like token counts and cost. Scores can attach to any level traces, spans, or generations and come from automated heuristics, LLM judges, or human reviewers.
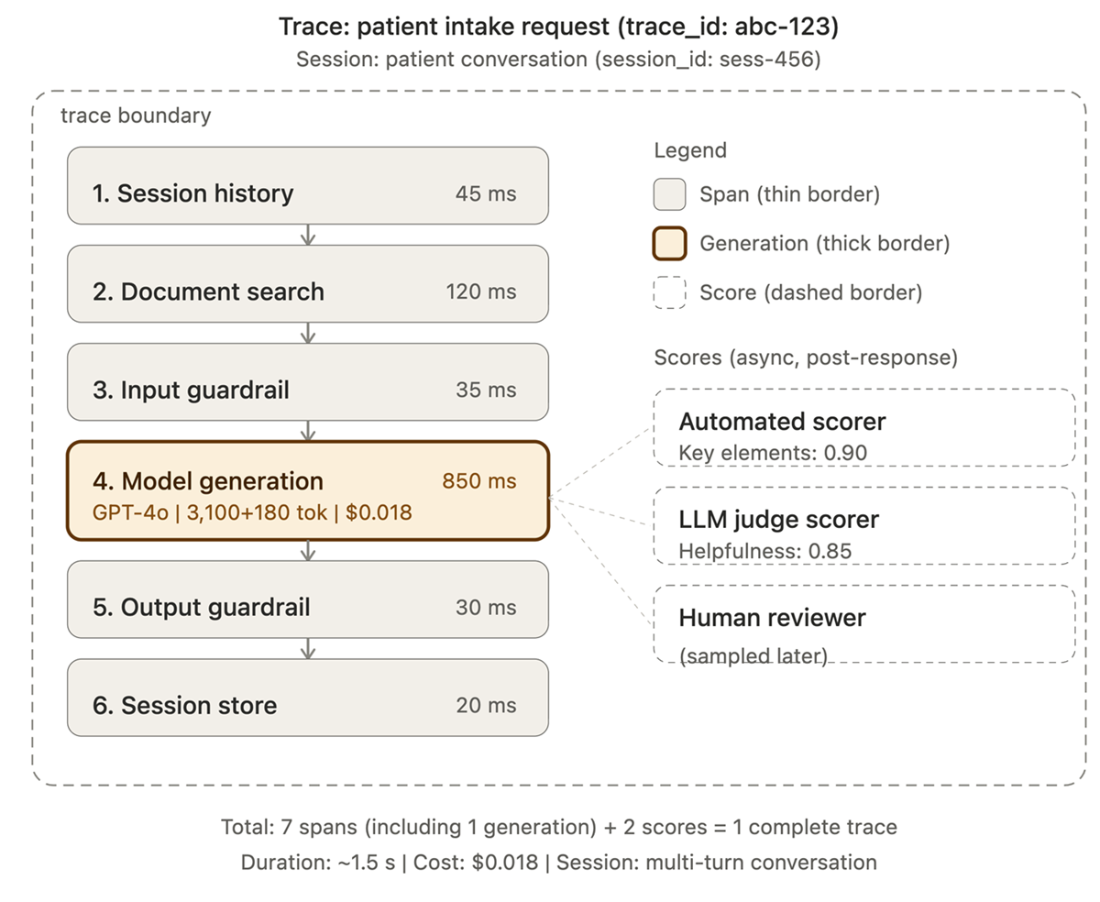
Trace walkthrough for a single patient intake request. Six spans (numbered 1-6) and one generation (step 4, thick border) form the trace. Scores attach asynchronously after the response is delivered. The legend distinguishes spans (thin border), generations (thick border), and scores (dashed, no fill) by border style so the diagram remains readable in grayscale print.
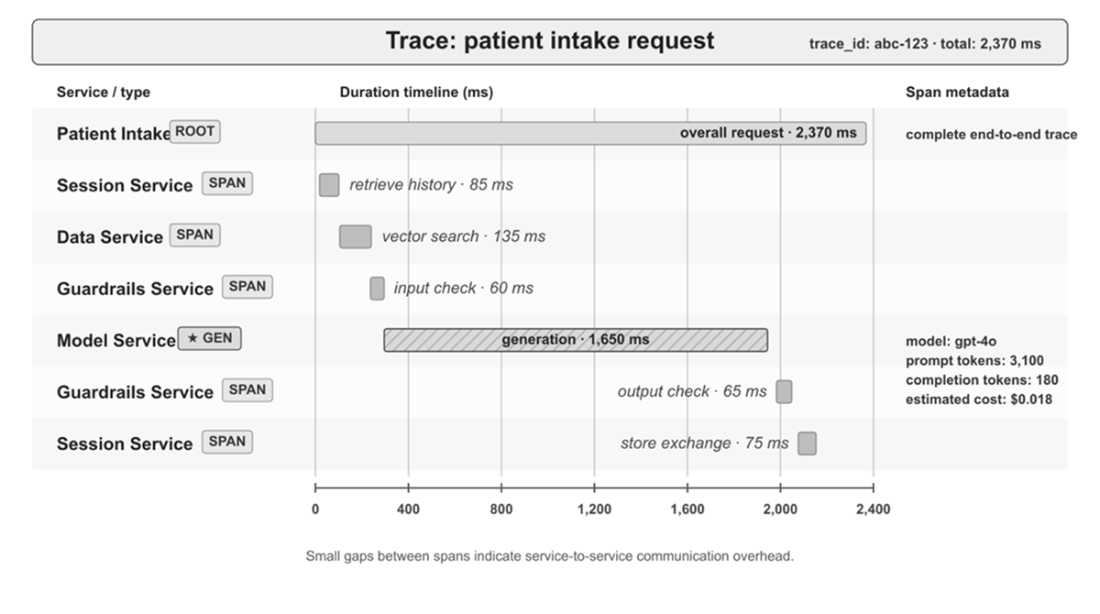
Distributed trace timeline for a patient intake request. The full request completes in 2,370 ms. The model generation step is the longest span at 1,650 ms, with associated metadata including model name, prompt tokens, completion tokens, and estimated cost. The remaining spans cover retrieval, validation, and persistence. Small gaps between spans represent communication overhead between services and help reveal where end-to-end latency is introduced
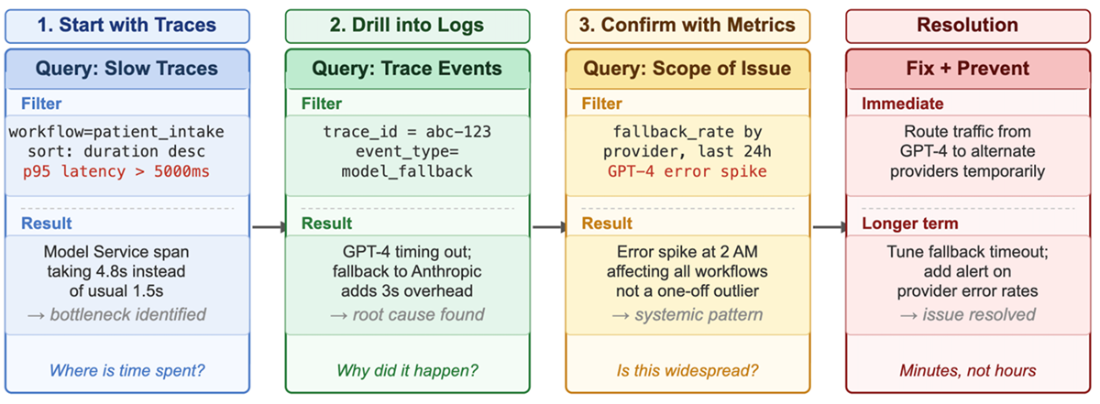
The three-level debugging workflow: trace → logs → metrics. Start with the trace view to identify which service is the bottleneck. Drill into that service's logs for the same trace_id to see the detailed event sequence. Confirm with metrics to determine whether the issue is a pattern or an outlier. This workflow resolves most production issues in minutes rather than hours.
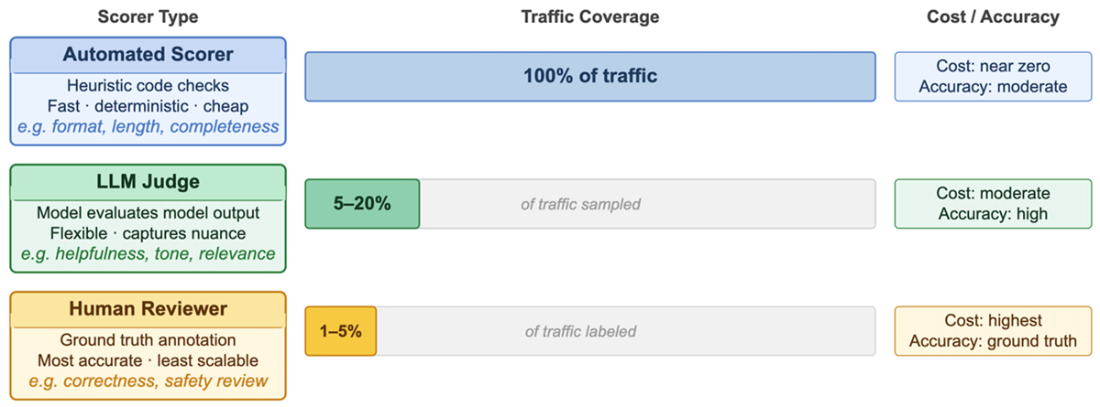
The three sources of quality scores and their calibration relationship. Automated scorers run on all traffic at near-zero cost. LLM judges sample 5-20% of traffic at moderate cost. Human reviewers label 1-5% at highest accuracy. Human scores calibrate both LLM judges (do they agree on helpfulness?) and automated scorers (are the heuristics catching real problems?). This layered approach gives broad coverage with targeted depth.
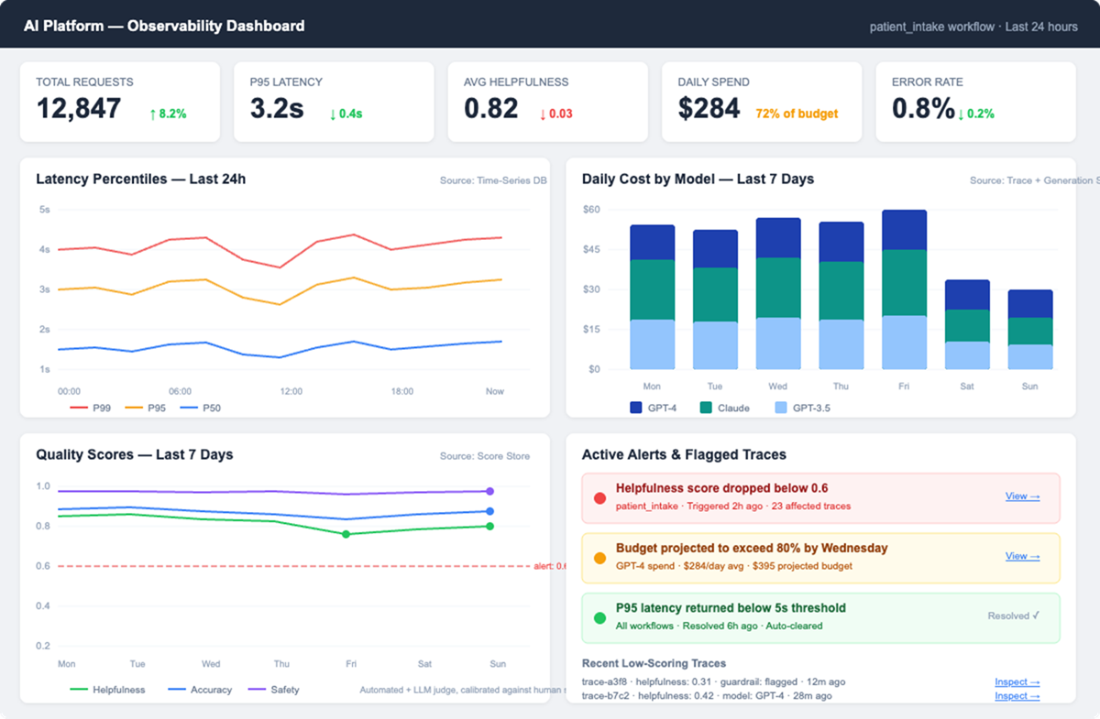
A sample observability dashboard. KPI cards provide an at-a-glance summary. The latency chart pulls from the Time-Series DB, the cost breakdown queries the Trace + Generation Store, and quality trends come from the Score Store. Alerts fire when metrics cross configured thresholds. Clicking any data point or flagged trace opens the trace viewer, closing the loop between aggregate monitoring and individual request debugging.
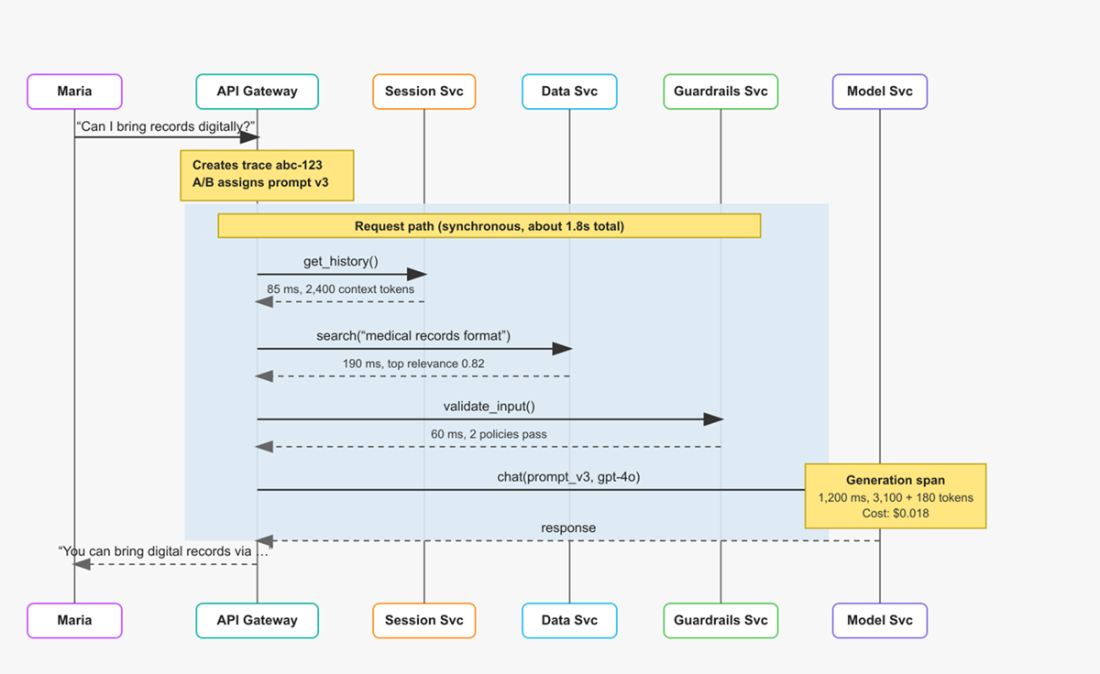
End-to-end synchronous request path for a single patient intake query. The workflow calls platform services in sequence to retrieve context, validate input, invoke the model, validate output, and return a response. Along the way, services emit spans, logs, and metrics that are assembled into a trace.
Summary
- AI systems need specialized observability beyond traditional monitoring because key dimensions (token consumption, model costs, response quality, and safety evaluations) don't exist in conventional applications.
- The observability data model defines five primitives: sessions group conversations, traces represent single requests, spans capture units of work, generations specialize spans for LLM calls, and scores attach quality signals at any level.
- The Observability Service provides fourteen operations across six concerns: logging, metrics, tracing with generation tracking, quality scoring, cost management, and health monitoring. Observability ingestion must never slow down user requests.
- Platform services report telemetry automatically through a two-layer design. TracedService, a base class that all services inherit, creates spans and propagates trace context for every operation. Domain-specific metrics publishers translate service-level data like token counts and guardrail evaluations into platform metrics. The ObservabilityClient buffers all telemetry locally and flushes it in batches, so individual service calls never add network round-trips to the request path.
- Structured log events carry AI-specific attributes (model, tokens, cost, guardrail results) linked to distributed traces through trace_id and span_id fields. Every service uses the same log structure; the flexible attribute maps accommodate service-specific context.
- AI-specific metrics use histograms over averages for the heavy-tailed latency distributions common in AI applications. Dimensional labels enable aggregation by provider, model, workflow, application, and team.
- Distributed tracing follows requests across all platform services via trace context propagation in gRPC metadata. The API Gateway seeds the trace_id, each service creates child spans through TracedService, and the Observability Service assembles everything into a complete trace after the fact. Generations, specialized spans for LLM calls, are first-class objects queryable independently from generic spans.
- The three-level debugging workflow (trace, logs, metrics) resolves most production issues: trace waterfalls identify the bottleneck, logs for that trace_id reveal the cause, and metrics confirm whether it's systemic.
- Scores from three sources (automated heuristics, LLM judges, and human reviewers) attach quality signals to traces, spans, or generations. Human scores calibrate automated and LLM-based scorers over time.
- Cost attribution aggregates per-request costs into dimensional drill-down reports. Budget alerts with progressive thresholds and projected spending prevent surprise invoices.
- The developer's workflow code stays clean. The trace context arrives from the API Gateway, and each service creates its own spans internally through TracedService, so complete traces appear without explicit instrumentation code.
- When developers need observability beyond what the platform provides automatically, the SDK exposes the same primitives that platform services use, so custom spans, metrics, and log events integrate seamlessly into the existing trace tree.

 Designing AI Systems ebook for free
