6 Summarizing and Analyzing DataFrames
This chapter shifts from data preparation to exploratory analysis in a distributed setting, showing how to summarize and probe large DataFrames efficiently with Dask. It frames core EDA goals—understanding distributions, discovering relationships, and detecting temporal patterns—while highlighting Dask-specific considerations such as partitioning, shuffling, task graphs, and when to persist or checkpoint work (for example, by writing Parquet). The tour covers built-in descriptive statistics, groupby/aggregate operations for correlation analysis, defining custom aggregations to implement statistical tests at scale, and applying rolling window functions to time-ordered data.
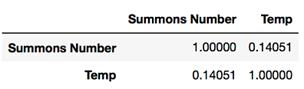
Using the NYC parking tickets dataset, the chapter first derives vehicle age, filters invalid years, and persists intermediate results to speed repetitive analyses. Descriptive statistics are computed via Series methods (mean, std, min, max) and dask.array for skewness, as well as describe for an efficient multi-metric pass. Interpreted results show an average vehicle age of about 6.74 years (std ≈ 5.66), with a minimum of 0, a maximum of 47, and positive skew (~1.01), implying a longer tail of older vehicles but more observations younger than the mean. It then demonstrates grouped aggregation to count citations by month and correlate them with average temperature; careful sorting of month-year labels and filtering incomplete months are key. The measured correlation is positive but weak (~0.14), reinforcing the reminder that correlation should not be confused with causation and that partitioning by the grouping column helps performance.
The chapter then builds a custom Aggregation to implement the Brown–Forsythe test for equal variances between private (PAS) and commercial (COM) vehicles, assembling chunk, combine, and finalize steps to compute the F statistic in parallel. The test rejects equal variances, so Welch’s t-test is run on locally collected NumPy arrays, yielding a decisive p-value and indicating the groups’ mean ages differ. It closes with rolling window functions: preparing a numeric, index-aligned month-year, noting that windows must not span beyond adjacent partitions, and applying a three-period moving average with optional centering to smooth monthly citation counts. Throughout, the guidance emphasizes scaling-aware patterns—aligning groupby keys with partitions, minimizing shuffles, persisting expensive transforms, and judiciously collecting to memory only when safe.
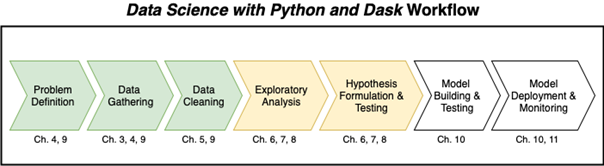
The Data Science with Python and Dask workflow
A visual guide to descriptive statistics

A comparison of standard deviation

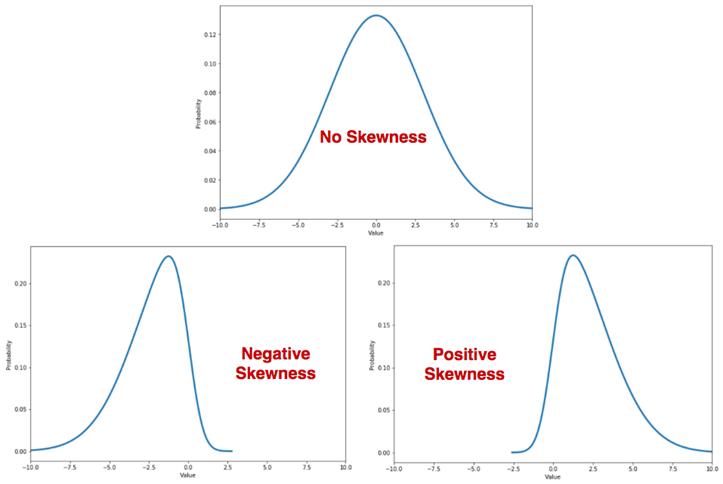
A visual comparison of skewness
Calculating the age of each vehicle at the time a citation was issued

A visual guide to correlation

An example of the split-apply-combine algorithm of an aggregate function

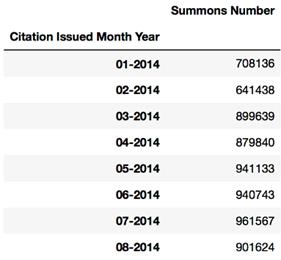
An abbreviated count of citations by month-year
The correlation matrix for Count of Summons and Temp
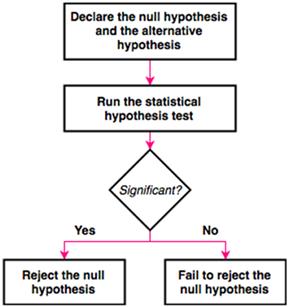
The process of statistical hypothesis tests
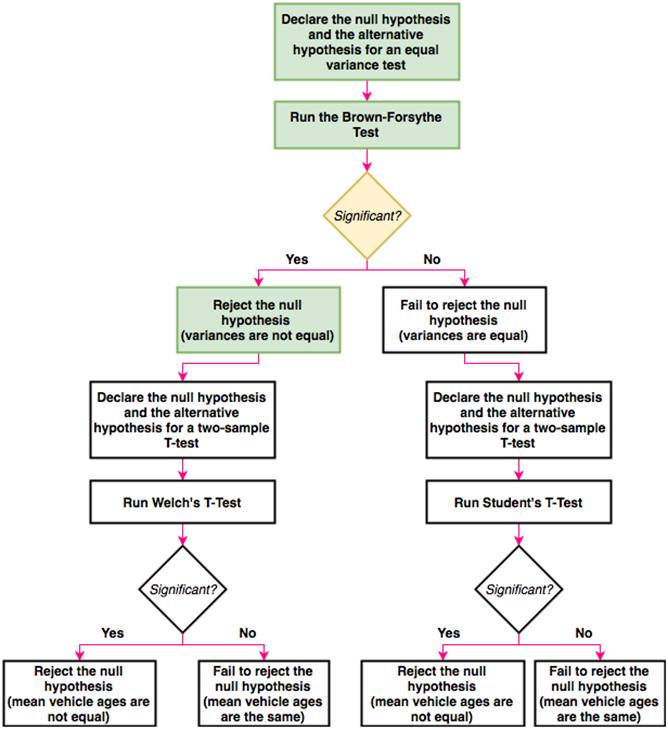
The process we will use to determine if mean vehicle age has any relationship with vehicle type

The Brown-Forsythe Test for Equal Variances

The first part of the Brown-Forsythe test
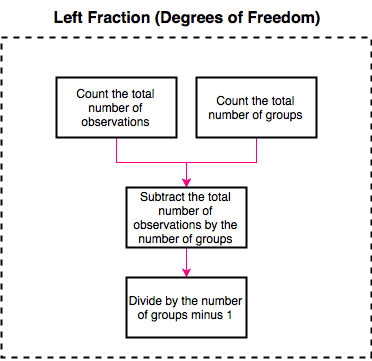
The process for calculating the right denominator

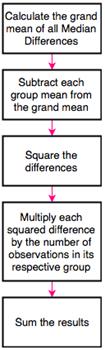
Our progress so far calculating the right denominator of the Brown-Forsythe equation

The process to calculate the right numerator of the Brown-Forsythe equation
We’ve rejected the null hypothesis of the Brown-Forsythe test, so we will next run Welch’s T-Test
Summary
In this chapter you learned
- Dask DataFrames have a number of useful statistical methods such as mean, min, max, etc. Even more statistical methods can be found in the dask.array.stats package.
- Basic descriptive statistics can be produced for a DataFrame or Series by using the describe method.
- Aggregate functions use the split-apply-combine algorithm to process data in parallel. Aggregating on a sorted column of a DataFrame will yield the best performance.
- Correlation analysis is used to compare two continuous variables, whereas the t-test is used to compare a continuous variable across a categorical variable.
- The Aggregate object can be used to define your own aggregate functions.
- Rolling functions can be used to analyze trends across a time index, such as moving averages. The data should be partitioned by time period for the best performance.

 Data Science with Python and Dask ebook for free
