Overview

2 Cybersecurity analytics toolkit

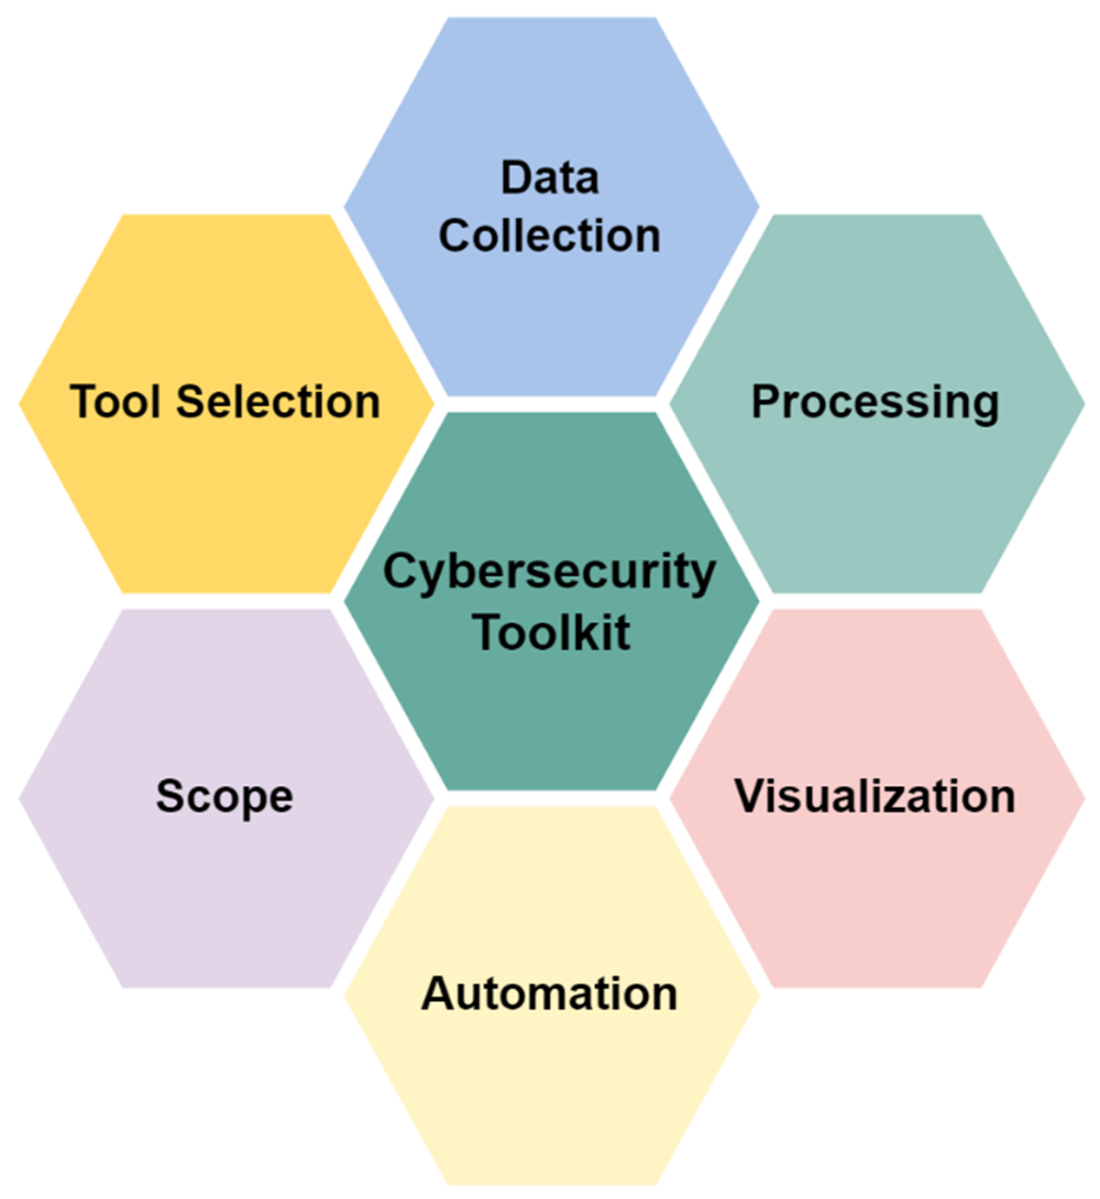
This chapter introduces a practical cybersecurity analytics toolkit built around four core capabilities—data collection, processing, visualization, and automation—working within a defined scope to accelerate threat detection and response. It explains how diverse telemetry from logs, network traffic, and endpoints is aggregated with tools like SIEMs and IDSs, then parsed, enriched, and correlated to create analyzable data. Effective visualization through dashboards distills large data volumes into trends, anomalies, and events that analysts can interpret quickly, while automation and seamless integration across tools shorten response times and improve the organization’s overall security posture.

Guidance on tool selection emphasizes aligning choices to specific objectives (threat detection, compliance, or incident response), as well as scalability, ease of integration, and usability for the team’s expertise. The chapter compares open-source and commercial options, highlighting tradeoffs among cost, customization, support, and time-to-value; it also underscores the importance of tuning SIEM rules and combining SIEM outputs with vulnerability management to reduce noise and prioritize risk. For dashboards, it lays out principles of clarity, relevance, accessibility, and consistency; shows how to choose metrics that are actionable and trend-aware; and illustrates role-based designs for analysts, executives, and compliance stakeholders that prompt investigation and decisions.

Statistical techniques are presented as essential for data-driven security: trend analysis to track shifts in attack activity, correlation analysis to uncover relationships (with caution that correlation is not causation), and probability distributions to forecast likely incident volumes and allocate resources. The chapter then outlines how to build an integrated analytics environment using SIEM, threat intelligence, and analytical platforms via APIs and automated workflows, optionally orchestrated through SOAR for faster, consistent response and reporting. Finally, it promotes a continuous improvement cycle—review, plan, implement, evaluate—to refine detections, evolve metrics, and incorporate new technologies such as AI, ensuring the toolkit adapts to emerging threats and changing business needs.

Cybersecurity toolkit consisting of the proper scope, tool selection, data collection, processing, visualization, and automation.
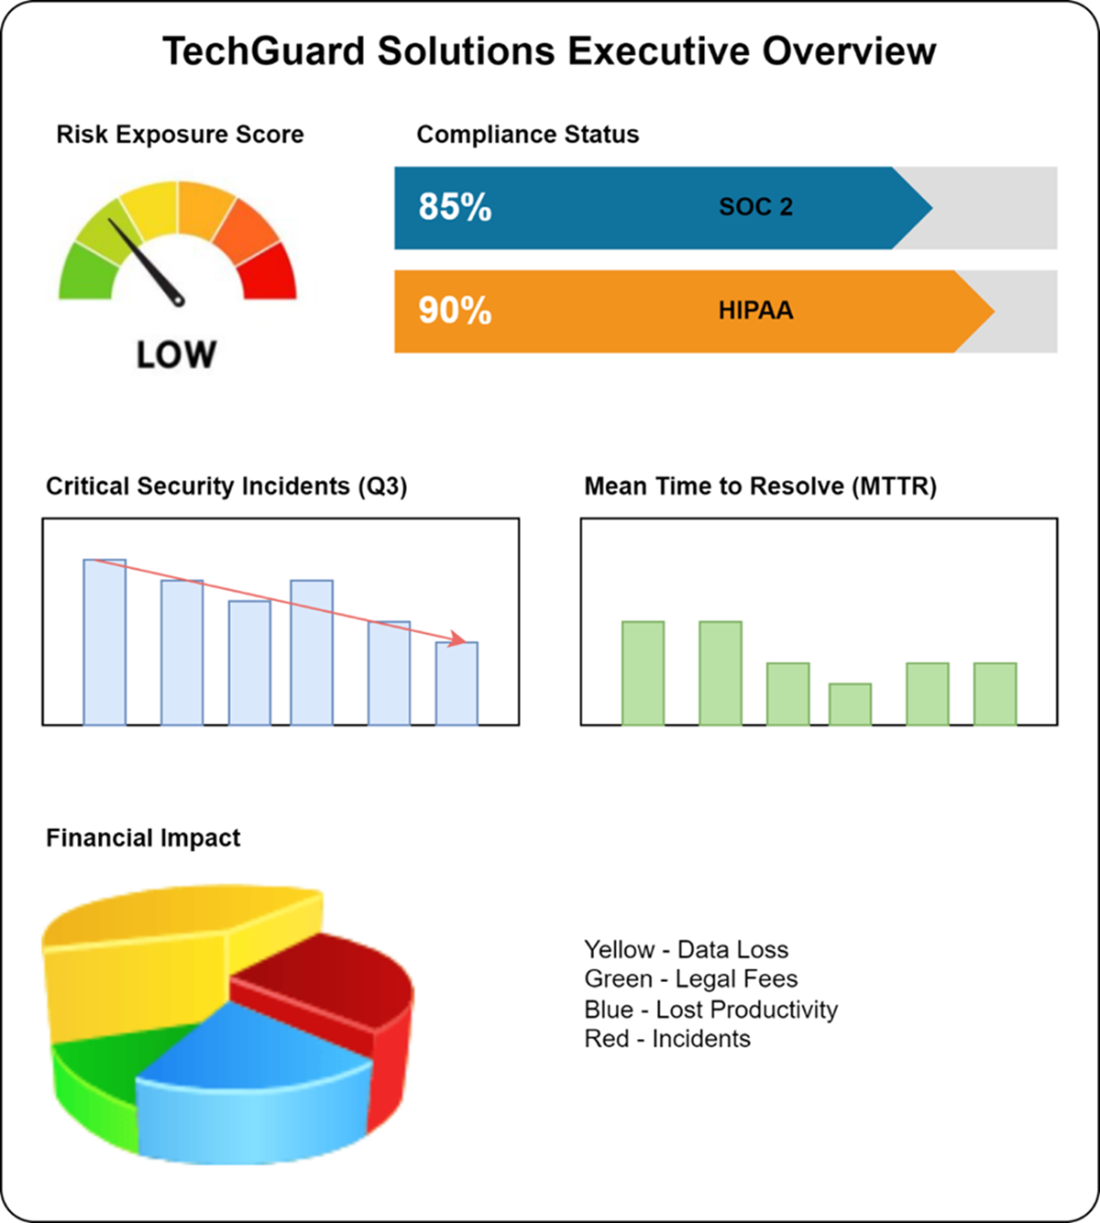
Example TechGuard executive dashboard showing an approximation of what the dashboard could look like.
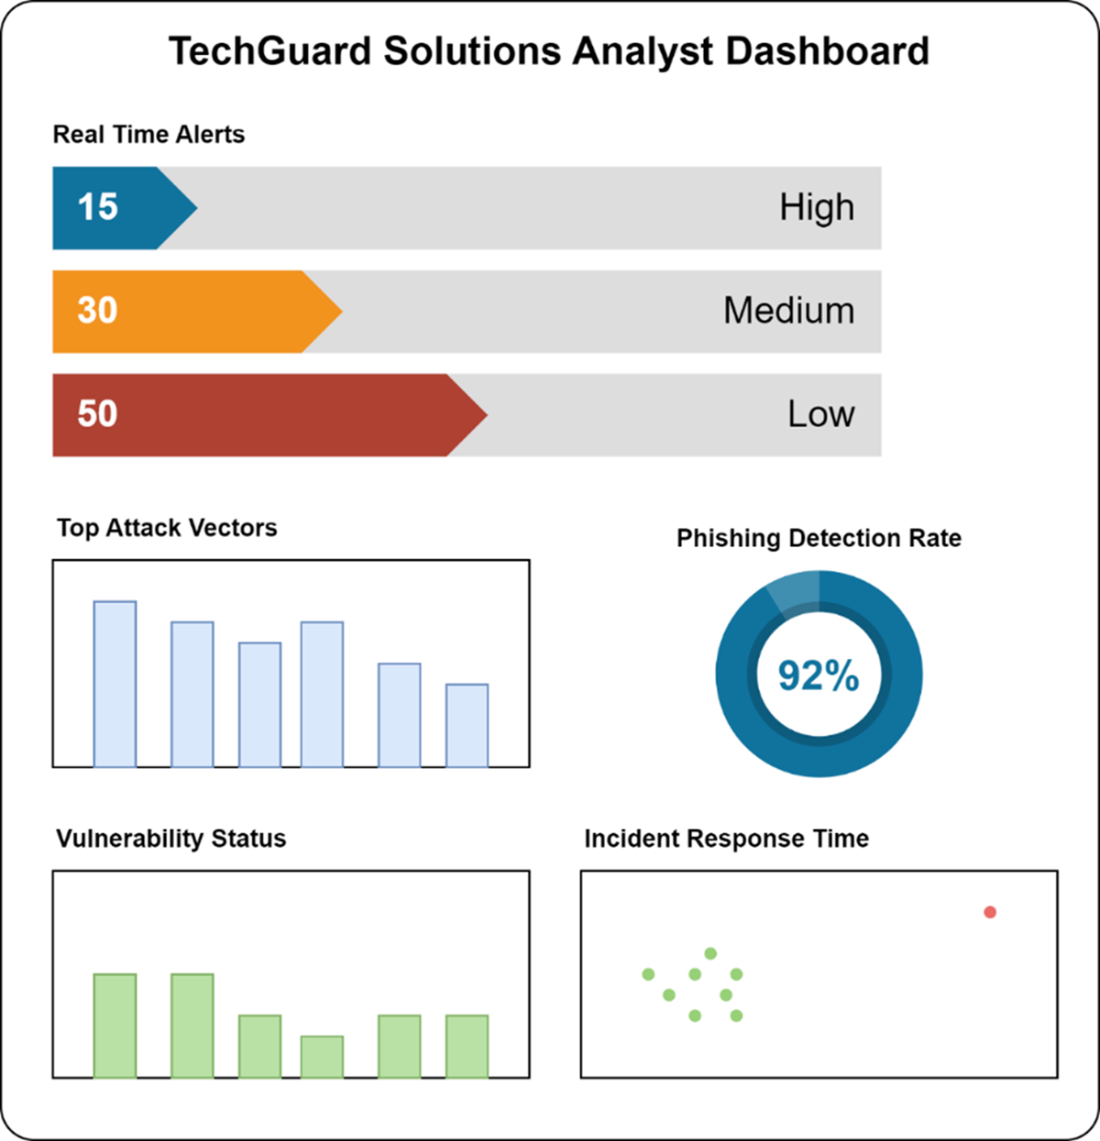
Example TechGuard analyst dashboard showing an approximation of what the dashboard could look like.
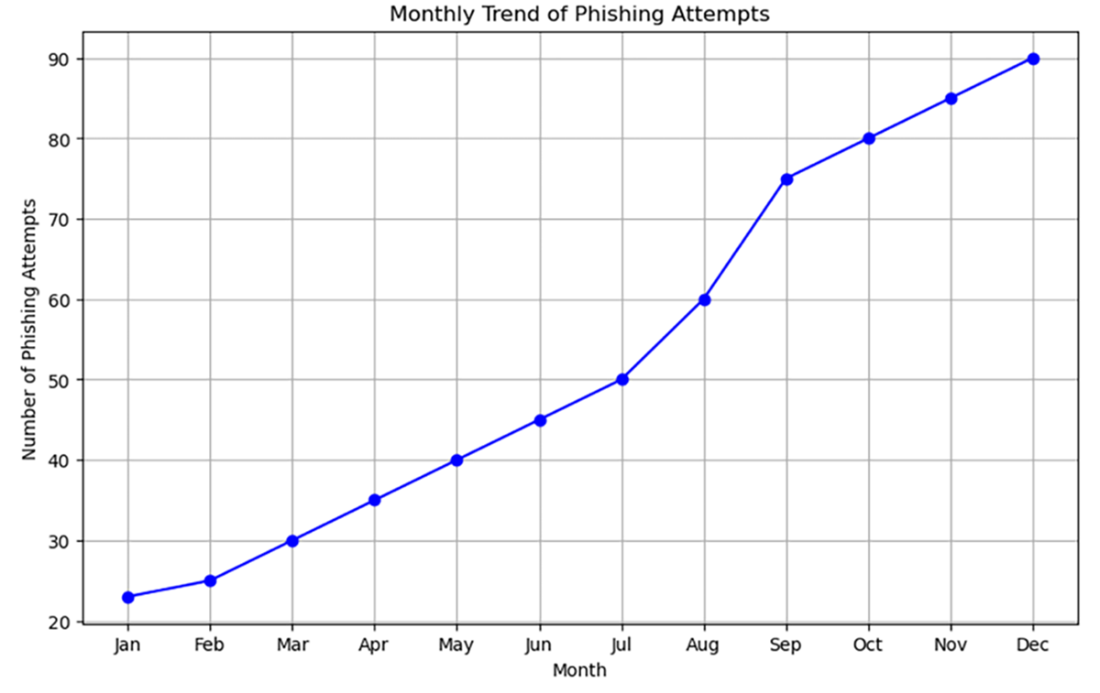
Monthly trend analysis of phishing attempts for the trend analysis exercise python code.
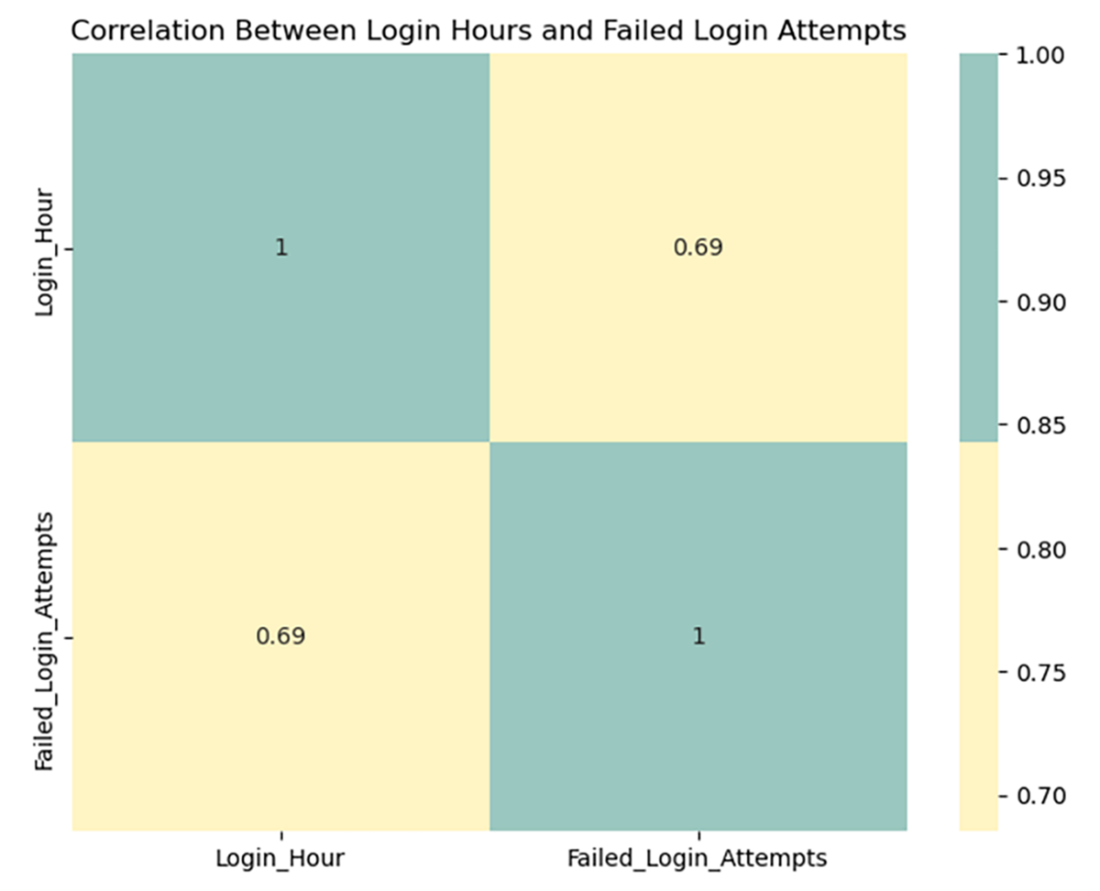
Correlation analysis Python code output.
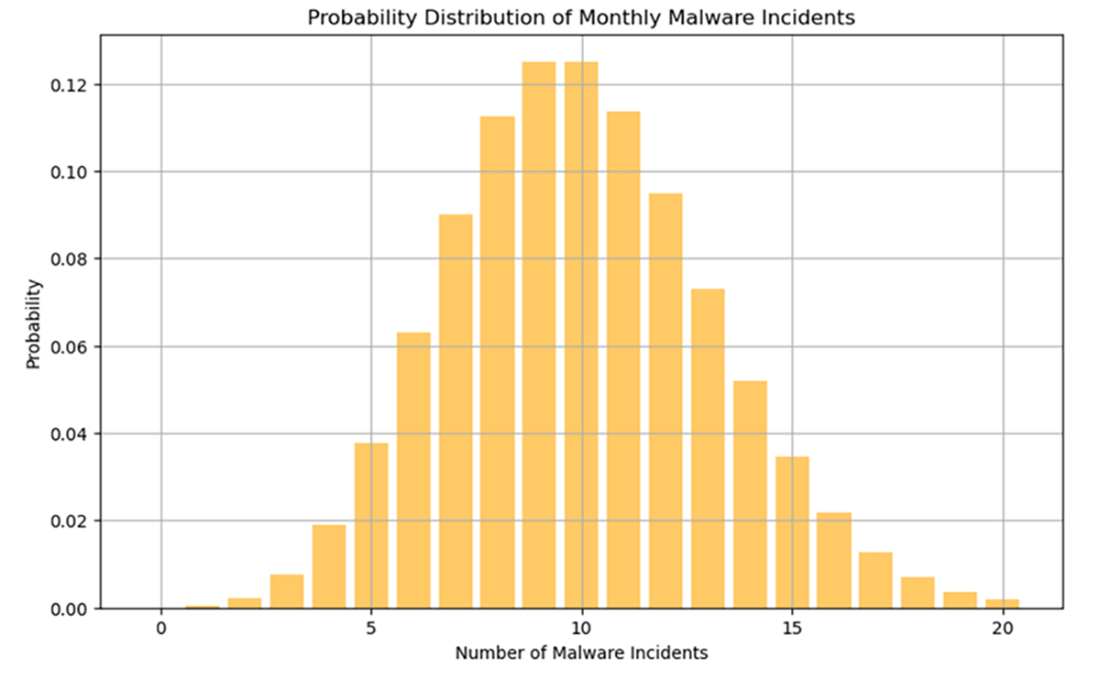
Probability distribution exercise Python code output.
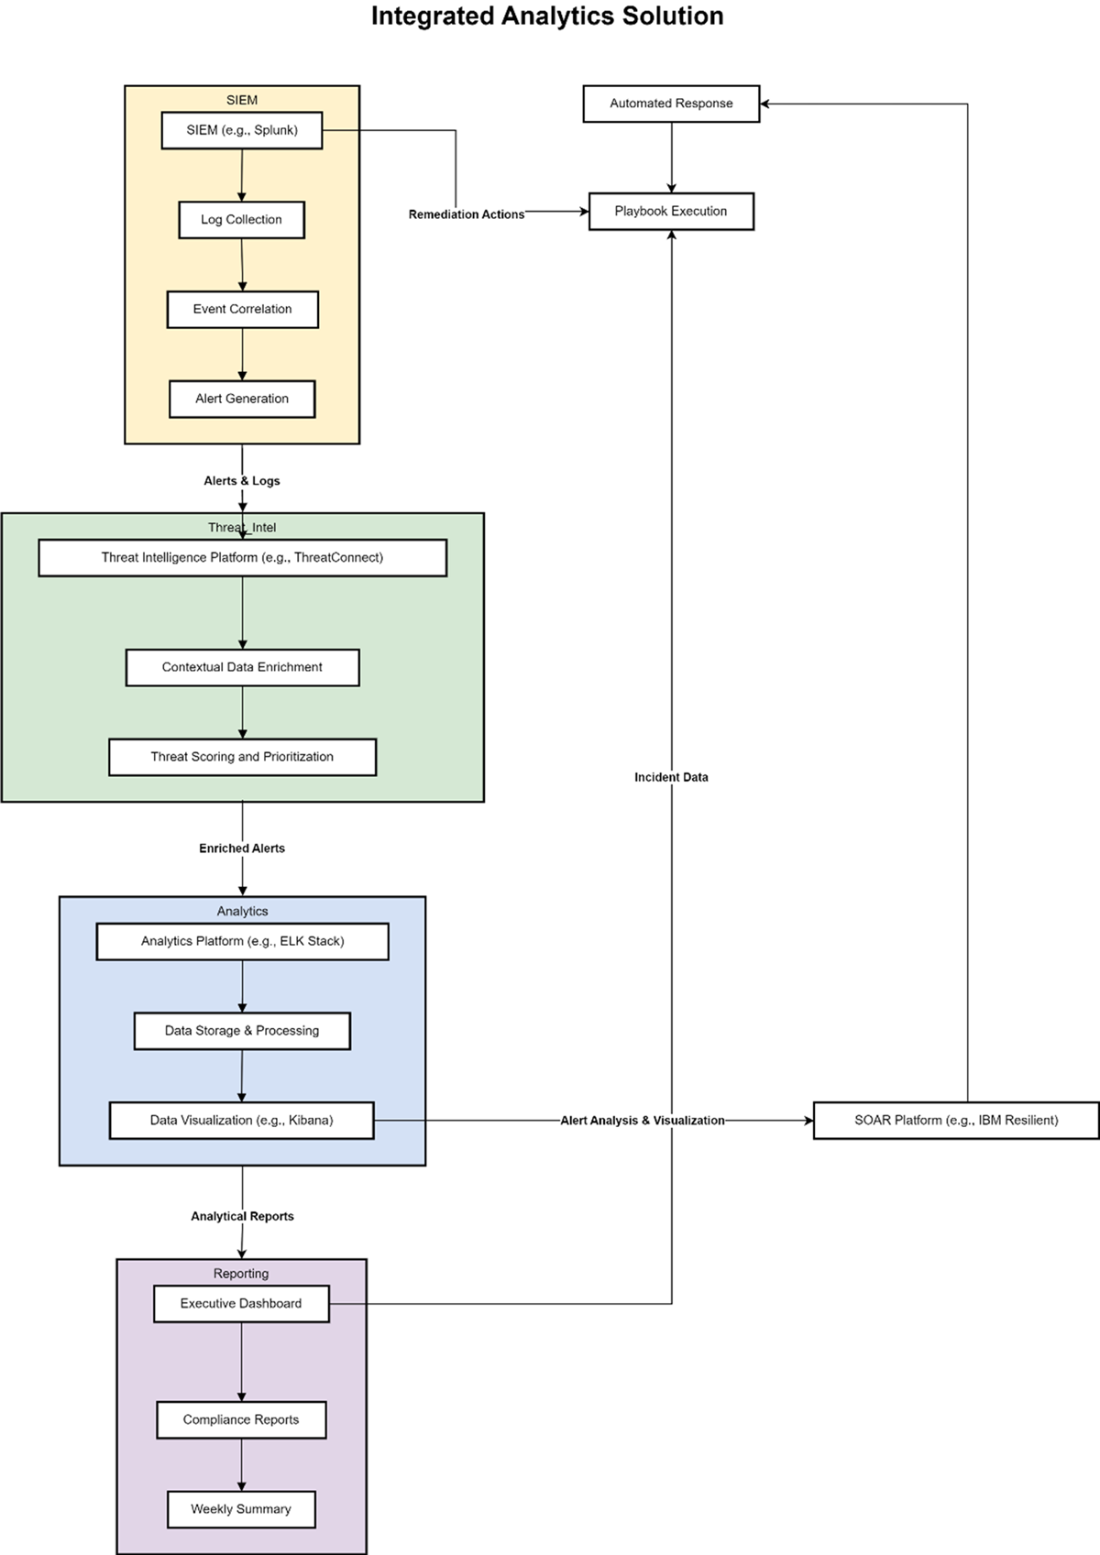
Example of an integrated security analytics environment.
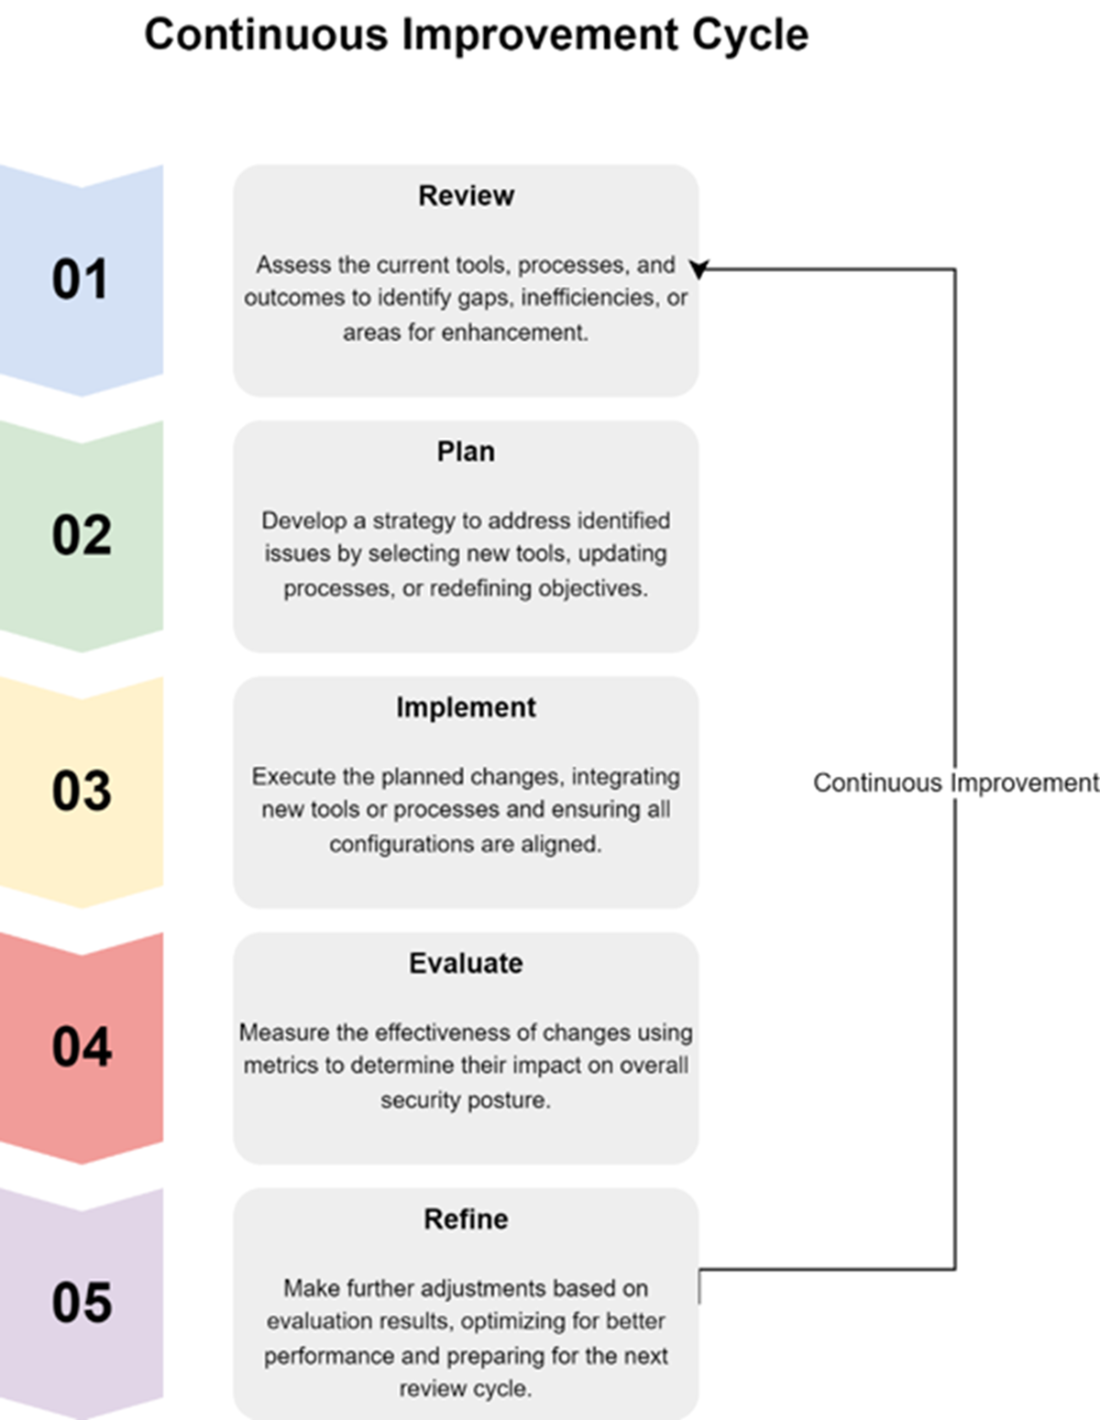
Continuous improvement cycle diagram as an example of how an organization can implement
Summary

  • A cybersecurity analytics toolkit includes tools for data collection, analysis, and visualization, enabling organizations to monitor, detect, and respond more effectively to security threats.
  • When selecting tools, organizations should consider functionality, integration ease, and scalability, ensuring that each tool aligns with security objectives and can adapt to future needs.
  • Effective dashboards enhance decision-making by clearly presenting key metrics, while strong communication practices ensure that security insights reach relevant stakeholders in an understandable format.
  • Statistical and AI techniques, such as anomaly detection and predictive modeling, equip analysts to uncover patterns and detect potential threats, strengthening overall security posture.
  • An integrated security analytics environment centralizes data and automates analysis, providing a cohesive approach to threat management across the organization.
  • Continuous improvement is essential for maintaining a relevant toolkit, with regular updates and adjustments ensuring the tools remain effective as security needs evolve.

FAQ

What are the core components of a cybersecurity analytics toolkit and what do they do?A complete toolkit spans data collection (logs, network, endpoints via SIEM/IDS), processing and normalization (parse, enrich, correlate), visualization (dashboards and graphs), and automation/integration (alerts, reporting, incident workflows). Together they deliver timely, actionable insights within the defined scope.
How should we choose the right security analytics tools for our organization?Start by clarifying objectives (threat detection, compliance, incident response) and needed capabilities (collection, analysis, visualization). Evaluate integration with existing systems, scalability, usability, team skills, support model, and budget to ensure long-term fit.
What are the trade-offs between open-source and commercial security tools?Open-source tools are cost-effective and customizable with community support but require more setup and expertise. Commercial tools offer out-of-the-box features and vendor support, at higher licensing costs and with potential vendor lock-in or reduced flexibility.
Which tool categories are essential, and what are common examples?Data collection/monitoring: Wireshark, Sysmon, OSQuery. Threat intelligence: MISP, Anomali. SIEM: ELK Stack, Splunk, QRadar. Vulnerability management: OpenVAS, Tenable Nessus, Qualys. Together they provide visibility, context, correlation, and risk prioritization.
How can we tune a SIEM to reduce false positives without missing real threats?Continuously refine correlation rules and detection thresholds, update rules regularly, and apply machine learning–driven analytics. Aim for a balance between sensitivity and specificity to limit alert fatigue while detecting emerging threats.
What are best practices for designing effective cybersecurity dashboards?Follow clarity, relevance, accessibility, and consistency. Keep visuals simple with clear labels and logical layout; choose appropriate chart types (bars for comparisons, lines for trends, pies for proportions); and make views actionable with drill-downs.
Which metrics should appear on analyst, executive, and compliance dashboards?Analysts: real-time alerts, event details, vulnerability status, threat intel/IoCs. Executives: risk exposure, compliance status, incident trends, MTTR, financial/ROI impact. Compliance: framework status (SOC2, HIPAA, GDPR), control coverage, audit findings/remediation.
How can statistical analysis improve security operations?Trend analysis highlights changes over time (e.g., rising phishing attempts). Correlation analysis surfaces relationships (e.g., late-night logins and failed attempts). Always apply context—correlation does not imply causation—to avoid misinterpretation.
How do probability distributions help forecast security incidents?Use distributions like Poisson to estimate the likelihood of monthly incident counts (e.g., most probable near the average). These forecasts guide staffing and capacity planning and should be revisited as threats evolve.
How do we build an integrated security analytics environment and keep it improving?Integrate SIEM, threat intelligence, and analytics via APIs/data pipelines; automate enrichment and SOAR workflows; and publish role-based dashboards with scheduled reports. Operate a feedback loop—review, plan, implement/test, evaluate/refine—to adapt detections, integrations, and metrics to new threats.

pro $24.99 per month

  • access to all Manning books, MEAPs, liveVideos, liveProjects, and audiobooks!
  • choose one free eBook per month to keep
  • exclusive 50% discount on all purchases
  • renews monthly, pause or cancel renewal anytime

lite $19.99 per month

  • access to all Manning books, including MEAPs!

team

5, 10 or 20 seats+ for your team - learn more


choose your plan

team

monthly
annual
$49.99
$499.99
only $41.67 per month
  • five seats for your team
  • access to all Manning books, MEAPs, liveVideos, liveProjects, and audiobooks!
  • choose another free product every time you renew
  • choose twelve free products per year
  • exclusive 50% discount on all purchases
  • renews monthly, pause or cancel renewal anytime
  • renews annually, pause or cancel renewal anytime
  • Data-Driven Cybersecurity ebook for free

choose your plan

team

monthly
annual
$49.99
$499.99
only $41.67 per month
  • five seats for your team
  • access to all Manning books, MEAPs, liveVideos, liveProjects, and audiobooks!
  • choose another free product every time you renew
  • choose twelve free products per year
  • exclusive 50% discount on all purchases
  • renews monthly, pause or cancel renewal anytime
  • renews annually, pause or cancel renewal anytime
  • Data-Driven Cybersecurity ebook for free