This chapter presents a practical, non-math-heavy guide to applying statistics in cybersecurity so practitioners can interpret metrics, spot patterns, and make confident, data-driven decisions. It frames statistics as a foundation for continuous improvement, emphasizing that even when tools and analysts perform the calculations, every security professional benefits from understanding the principles behind risk quantification, control effectiveness, and trend interpretation. Throughout, accessible Python examples and visualizations are used to connect concepts to realistic security tasks, from monitoring vulnerabilities and user behavior to incident response.
The narrative centers on building a feedback-driven program: establish baselines, choose meaningful metrics, monitor trends, and validate changes with statistical testing. Techniques such as moving averages, regression, correlation, and Bayesian reasoning turn raw signals into actionable insights, while SMART goals and routine reviews keep efforts focused and measurable. Representative metrics—like time to resolve incidents, phishing detection rates, and patch velocity—anchor analysis to operational outcomes, and the chapter highlights freely available tools and learning resources to lower barriers to adoption.
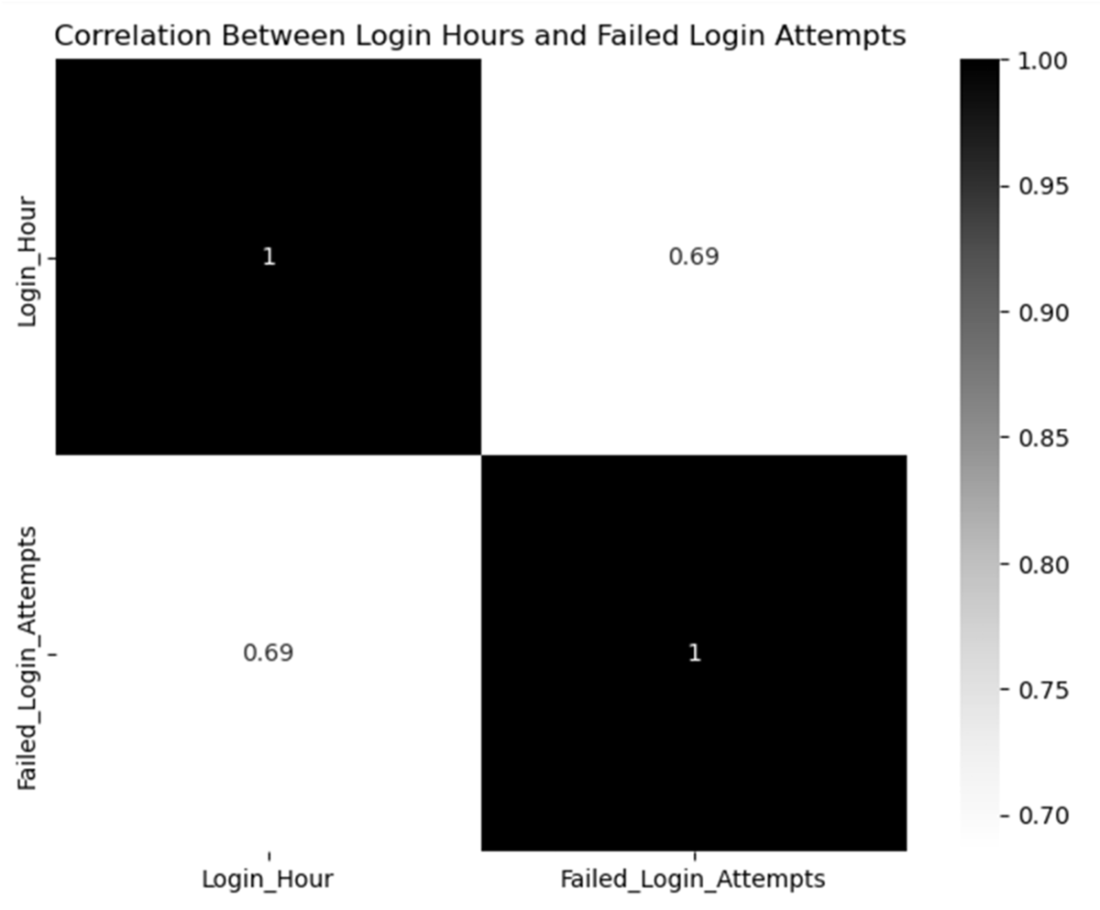
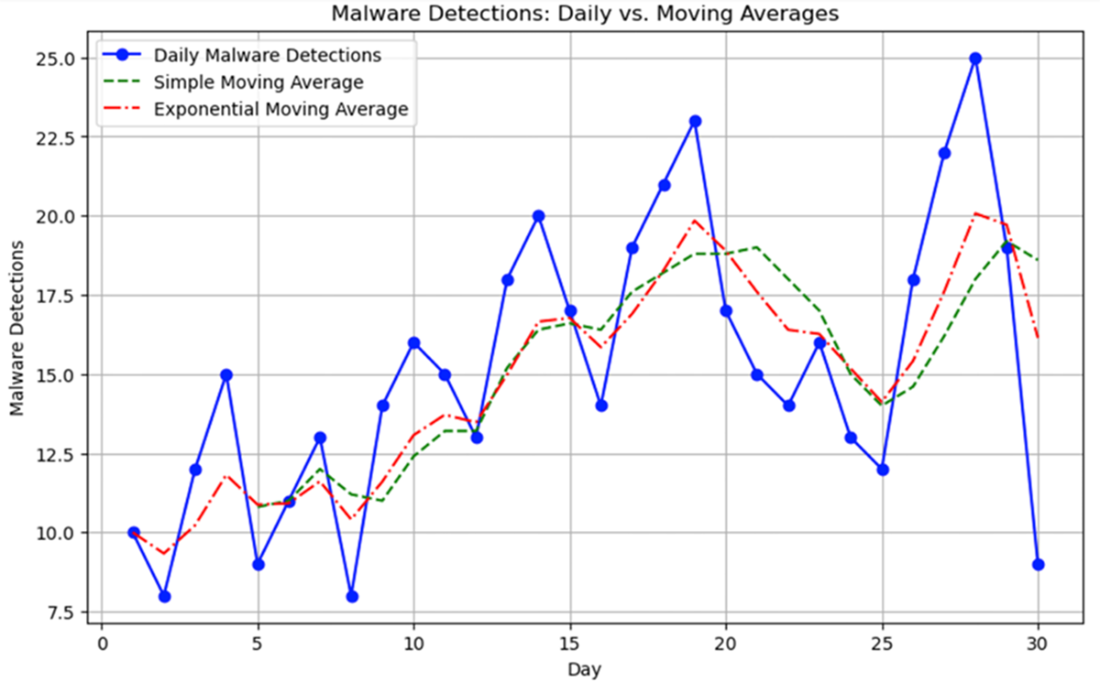
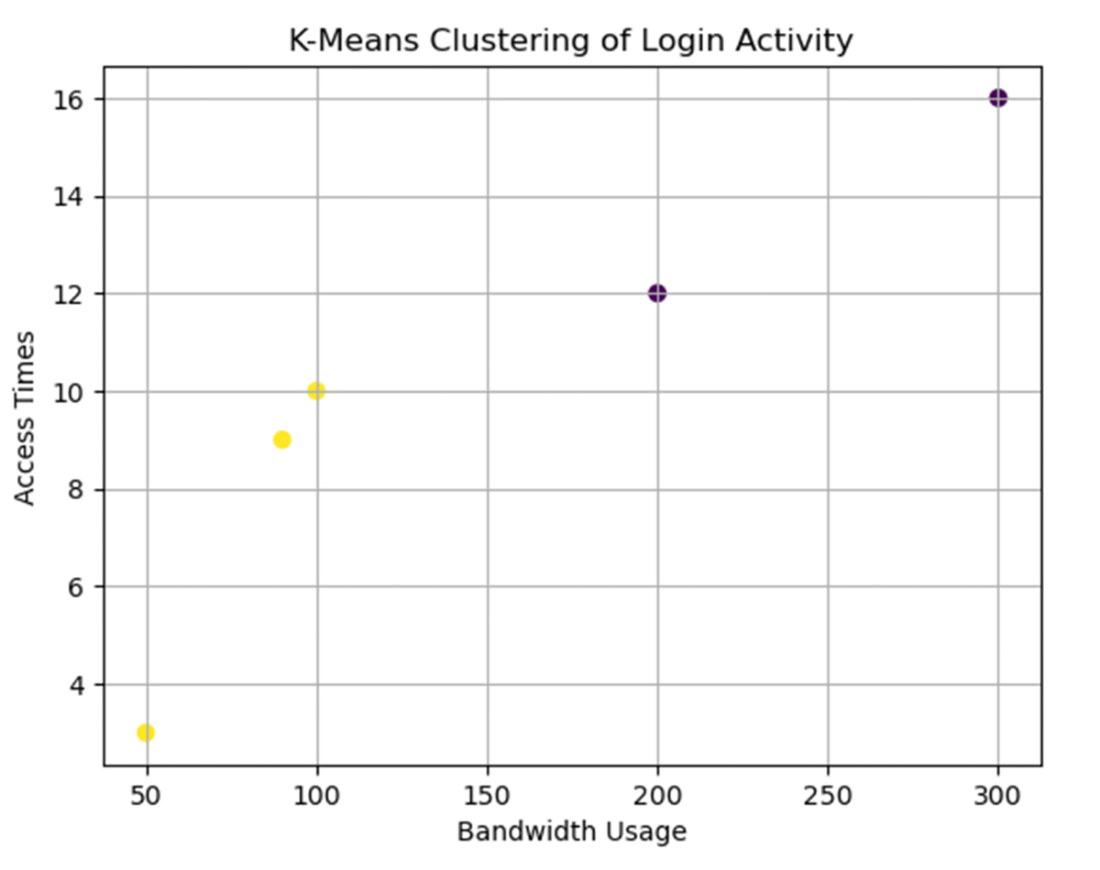
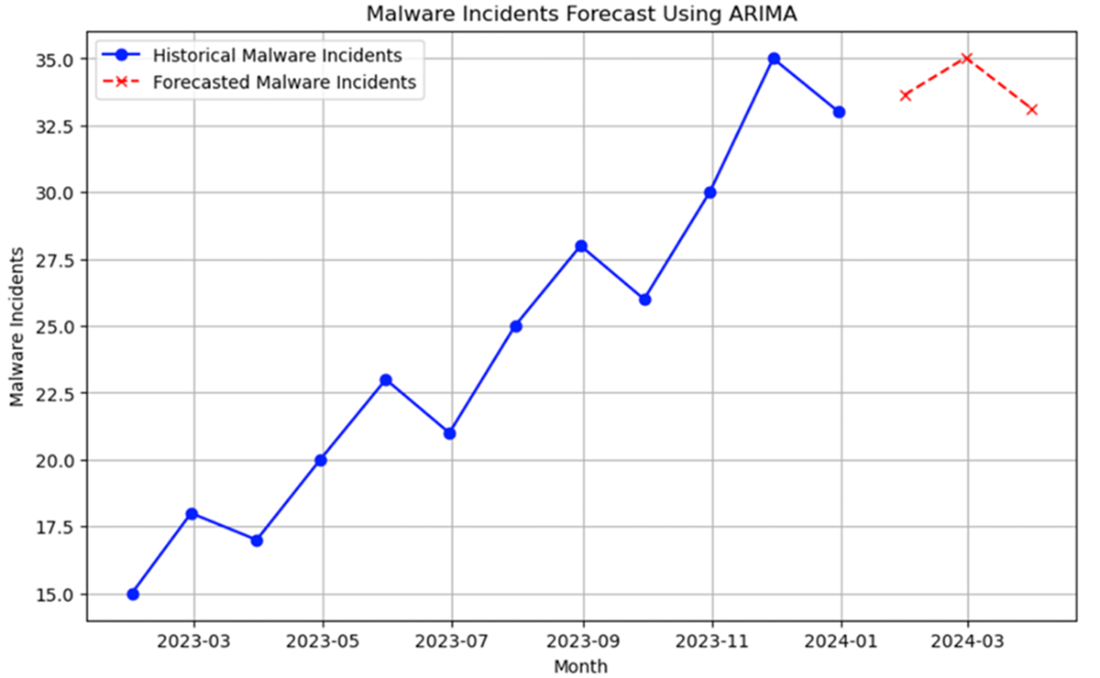
Several methods are showcased in context: correlation analysis to reveal hidden relationships (for example, between login hours and failed attempts), moving averages (SMA/EMA) to smooth noise and surface directionality, and clustering (e.g., K-means) to group similar behaviors and flag anomalies. Forecasting with ARIMA demonstrates how historical patterns inform forward-looking planning, while Bayesian inference shows how to update threat probabilities as evidence arrives, reducing false positives/negatives. Finally, probabilistic modeling with the Poisson distribution illustrates how to estimate exploit frequencies and prioritize remediation. Together, these tools create a disciplined, iterative approach to measuring, predicting, and improving security posture.
Heatmap showing correlation between login hours and failed login attempts.
Malware detections output from sample code.
Clustering the output of login activity.
Malware incidents forecast showing the forecasted malware incidents in dot-x and historical malware incidents in solid-dot.
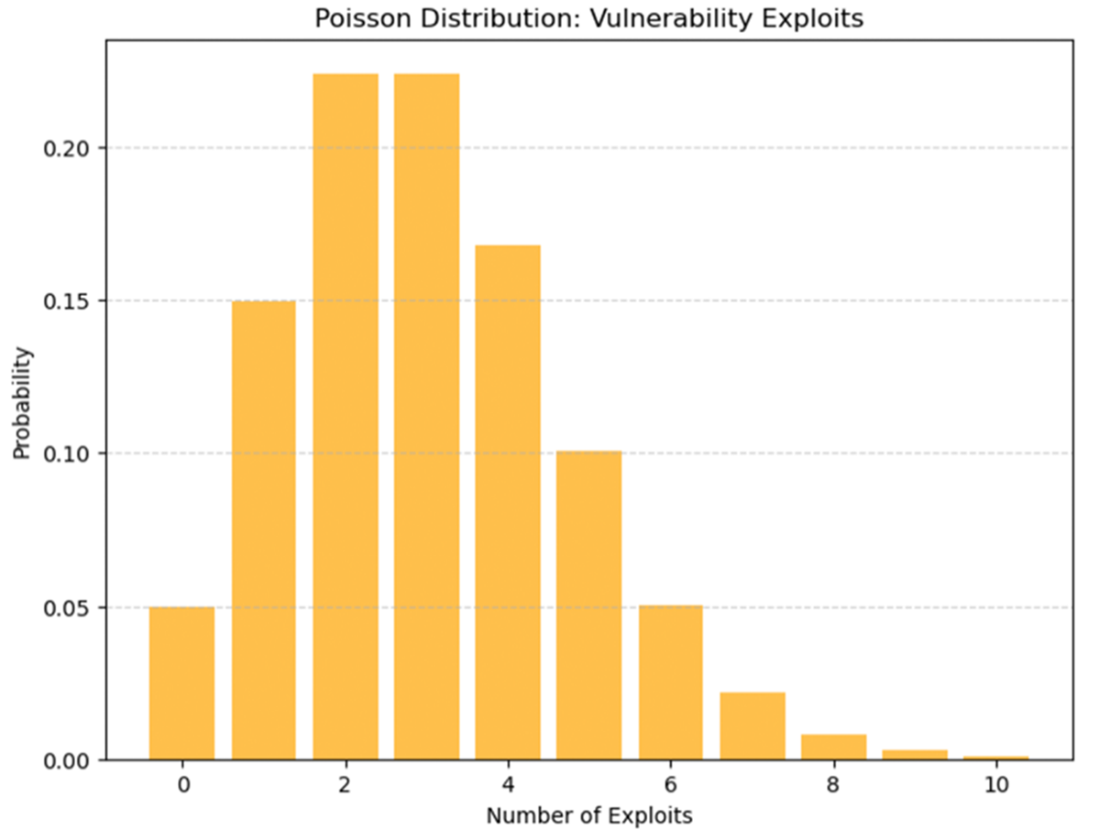
Poisson distribution of vulnerability exploits
Summary
Statistical techniques can be applied to analyze and strengthen cybersecurity measures effectively.
Time series analysis can be used to forecast potential future threats and prepare proactive defense strategies.
Correlation and clustering methods can be used to identify key risk factors by exploring relationships between variables.
Bayesian inference can improve decision making under uncertainty by updating probabilities with new data.
The Poisson distribution can be applied to model and prioritize vulnerabilities based on their likelihood and impact.
FAQ
Why do I need statistics if I’m not doing the math or coding?Because tools and analysts do the computations, your job is to interpret them. Statistical literacy helps you read metrics correctly, spot meaningful trends, question assumptions, and make defensible, data-driven decisions about controls, budgets, and risk.Which security metrics should I start with?Begin with Time to Resolve Incidents, Phishing Detection Rates, and Vulnerability Patch Rates. Establish baselines, monitor trends (e.g., with moving averages), and use statistical tests to confirm whether changes (like a new control) produced real, measurable improvements.What tools and resources do I need to run the chapter’s examples?Use Jupyter Notebooks (https://jupyter.org/) with Python libraries such as pandas, statsmodels, scikit-learn, seaborn, and matplotlib. The code is available at https://github.com/Mariano215/Security_Metrics. For practice data and tutorials, see https://www.kaggle.com, and align your metrics with the NIST Cybersecurity Framework (https://www.nist.gov/cyberframework).How do I build a continuous-improvement feedback loop with metrics?Set SMART goals tied to risk (e.g., reduce unpatched critical vulns by 20% in 6 months), track metrics routinely, smooth noise with moving averages, evaluate changes with statistical tests or regression, and periodically review results to adapt policies. Forecast future load (e.g., with ARIMA) to prepare resources before demand spikes.How does correlation analysis help, and how do I read a heatmap?Correlation measures the strength and direction of association (from -1 to 1) between variables; a heatmap visualizes these values. It reveals patterns (e.g., failed logins rising during certain hours) that inform controls, but it does not prove causation—watch for confounders, seasonality, and spurious relationships.What’s the difference between SMA and EMA, and how do I choose a window?The Simple Moving Average (SMA) smooths fluctuations evenly over a window, while the Exponential Moving Average (EMA) weights recent data more, reacting faster to changes. Short windows catch spikes quickly but add noise; longer windows emphasize stability. Choose based on your goal: rapid detection (EMA, shorter) vs. trend clarity (SMA, longer).How can K-means clustering surface anomalies in login or device activity?K-means groups entities (e.g., devices) by behavioral features such as bandwidth usage and access times. Points that fall into small, distant clusters—or far from cluster centroids—are candidates for anomalous behavior worth investigating. Scale features, try different k values, and validate findings with domain context.How do I use ARIMA to forecast incidents, and what should I validate?Fit an ARIMA(p,d,q) model to historical incident counts, ensure stationarity (or difference the series), examine residuals, and backtest forecasts. Use projections to plan staffing and controls proactively. Refit routinely to handle concept drift and avoid overfitting on short or atypical histories.What is Bayesian inference and how does it reduce false positives?Bayesian inference updates the probability of a threat given new evidence by combining a prior (historical likelihood) with a likelihood (signal quality). Computing P(threat | alert) helps prioritize high-posterior alerts, tune thresholds, and cut noise; priors can be derived from SIEM/IR data and updated as evidence accumulates.How does the Poisson distribution support vulnerability management?Use a Poisson model to estimate the probability of observing a given number of exploits in a fixed interval based on an average rate (lambda). This sets realistic expectations, guides resource allocation, and informs risk communication. Validate assumptions (independent events, roughly constant rate) and adjust with newer data.
pro $24.99 per month
access to all Manning books, MEAPs, liveVideos, liveProjects, and audiobooks!

 Data-Driven Cybersecurity ebook for free
