The chapter explains how rapid advances in AI—especially generative and agentic systems—are reshaping cybersecurity measurement from reactive, point-in-time reporting to proactive, predictive decision-making. It contrasts traditional, backward-looking metrics with advanced metrics that fuse historical incidents, real-time telemetry, and threat intelligence to describe what is happening, why it is happening, who is involved, and what is likely to happen next. Building this capability requires collaboration between security teams, data scientists, and leadership, plus a tooling stack that can collect, enrich, and model large volumes of data to guide risk-informed action.
It introduces a suite of advanced metrics across the defense lifecycle. For risk exposure and forecasting, it presents the Risk Exposure Index (REI) and Predictive Threat Index (PTI). For detection performance, it emphasizes anomaly-centric measures such as Anomalous Behavior Detection Rate (ABDR), Time to Predict (TTP), and Dynamic Risk Scoring (DRS). In cloud and network contexts, it focuses on Cloud Threat Detection Accuracy (CTDA) and the Attack Surface Index (ASI). To gauge AI effectiveness, it tracks False Positive Suppression Rate (FPSR) and AI-based Decision Accuracy (AI-DA), alongside reductions in response time and improved alert prioritization. Throughout, it shows how open-source and commercial platforms—such as vulnerability scanners, SIEM/analytics stacks, EDR/XDR, and threat intelligence platforms—can operationalize these metrics.
Practical scenarios demonstrate setting baselines, targets, and feedback loops to drive measurable improvements: lowering exposure and predicted attack likelihood, raising anomaly detection accuracy while cutting prediction time, tightening cloud detections and shrinking attack surface, and improving threat hunting outcomes while reducing incident impact. The chapter closes by framing continuous improvement around Risk Mitigation Velocity (RMV) and Mean Time to Predict (MTP), reinforcing that the “right” metrics are organization-specific. By aligning metrics to business objectives and tuning models to reduce false positives and accelerate response, teams can move from reactive firefighting to a continuously learning, proactive security posture.
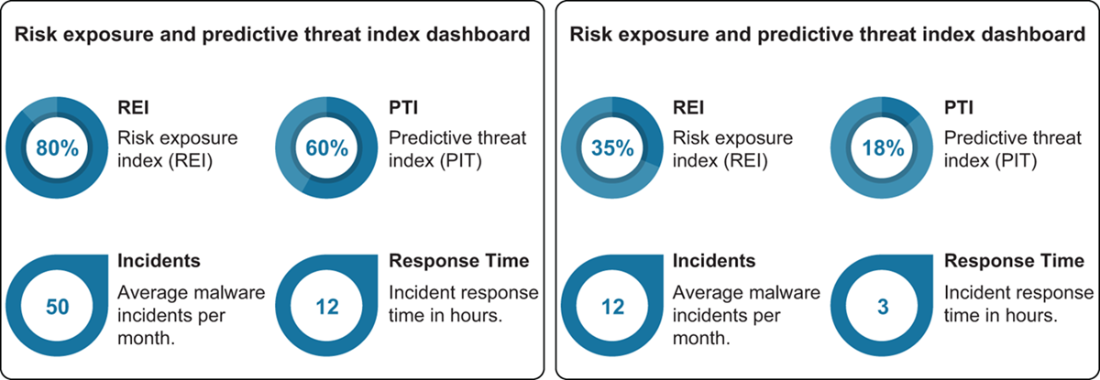
The left shows risk exposure and predictive analytics before implementing improvements. On the right shows risk exposure and predictive analytics after implementing improvements.
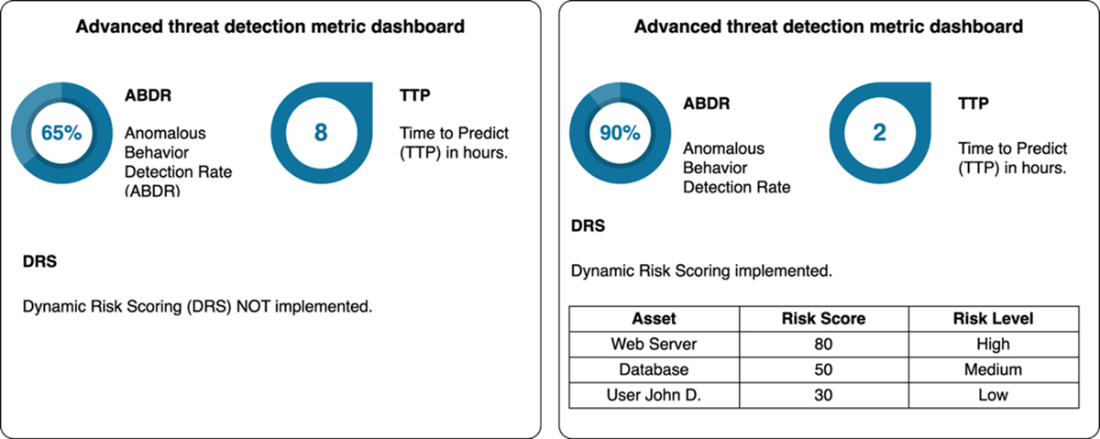
On the left shows the advanced threat detection metric dashboard for SecureShield before implementing improvements. On the right shows the metrics after implementing dynamic risk scoring with anomaly detection and real-time threat intelligence feeds.
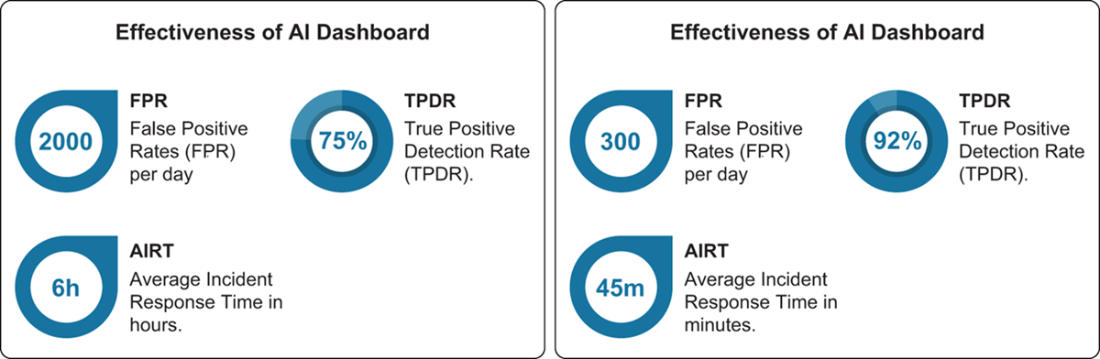
On the left shows the effectiveness of the AI Dashboard, showing daily false positive rates, true positive detection rates, and the average incident response time. On the right shows the effectiveness of the AI Dashboard after implementing an AI-driven solution, showing daily false positive rates, true positive detection rates, and the average incident response time.
On the left shows the cloud and network threat management dashboard showing CTDA and ASI metrics prior to improvements. On the right shows the cloud and network threat management dashboard showing CTDA and ASI metrics after implementing improvements.
On the left shows the incident management dashboard showing ATHSR and IIE metrics prior to improvements. On the right shows the Incident management dashboard showing ATHSR and IIE metrics after implementing improvements.
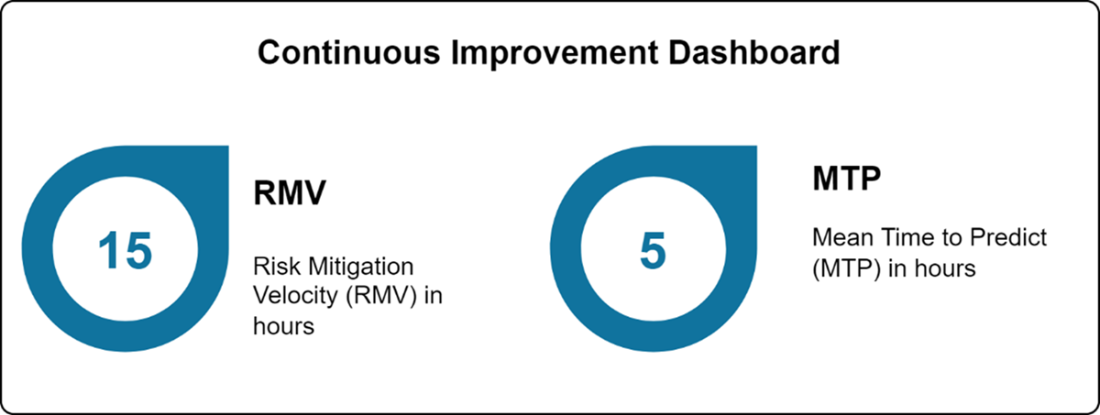
On the left shows the continuous improvement dashboard prior to implementing improvements. On the right shows the continuous improvement dashboard after implementing improvement.
Summary
Advanced cybersecurity metrics provide a data-driven approach to anticipating and mitigating future threats.
Predictive analytics, like the Risk Exposure Index (REI) and Predictive Threat Index (PTI), help organizations estimate potential risks and prepare proactive defenses.
Metrics such as Anomalous Behavior Detection Rate (ABDR) and Dynamic Risk Scoring (DRS) enhance the accuracy of threat detection and response, especially when integrated with AI.
False Positive Suppression Rate (FPSR) and AI-Based Decision Accuracy (AI-DA) assess the efficiency and accuracy of AI-driven cybersecurity systems.
Continuous improvement through metrics like Risk Mitigation Velocity (RMV) ensures that organizations adapt quickly to emerging threats and vulnerabilities.
FAQ
What distinguishes advanced cybersecurity metrics from traditional metrics?Advanced metrics are forward-looking and predictive. They don’t just report what happened; they estimate what is likely to happen next and why. They leverage AI, machine learning, and real-time data to anticipate threats, guide proactive defenses, and align security actions with business impact.How do Risk Exposure Index (REI) and Predictive Threat Index (PTI) work, and how are they calculated?REI quantifies current organizational risk by combining vulnerability burden, asset criticality, and likely impact. Simple form: REI = (Total Vulnerability Score / Total Assets) × Business Impact Factor. PTI estimates the probability of future incidents using history and threat intel. Simple form: PTI = (Number of Incidents × Threat Likelihood) / Total Assets. Track both over time to prioritize mitigation and validate improvements.Which data sources and tools are recommended to build predictive analytics for REI/PTI?- Vulnerability data: OpenVAS (or Qualys/Nessus) with CVSS scores
- Logs and events: Elastic Stack (Elasticsearch, Logstash, Kibana)
- Threat intelligence: MITRE ATT&CK, OTX; platforms like Cortex/TheHive
- Real-time monitoring/ML integration: Wazuh, Splunk
- Modeling and custom ML: Python with scikit-learn/TensorFlow
Combine historical incidents, current vulnerabilities, and threat intel into curated datasets for modeling.How can anomaly detection be measured with ABDR, and how do we reduce false positives?ABDR (Anomalous Behavior Detection Rate) measures the share of true anomalies correctly detected out of all anomalies flagged. Improve it by:
- Building strong baselines of “normal” behavior
- Using adaptive ML models that learn over time
- Tuning thresholds and features
- Feeding quality threat intel
- Regularly reviewing false positives/negatives and retraining modelsWhat is Time to Predict (TTP) and Mean Time to Predict (MTP), and why do they matter?TTP = Prediction Time − Data Ingestion Start Time for a specific event; MTP is the average across events. Shorter TTP/MTP provide earlier warning, enabling preemptive actions (e.g., blocking ransomware pre-encryption). Reduce TTP/MTP by streamlining data pipelines, improving model efficiency/accuracy, and integrating real-time threat intelligence.What is Dynamic Risk Scoring (DRS), what inputs does it use, and how is it applied operationally?DRS assigns real-time risk to assets/users/events and updates continuously. Typical inputs:
- Current vulnerabilities (e.g., CVSS-based)
- Threat intelligence (active IOCs, campaigns)
- Monitored activities (anomalous logins, data egress, rare connections)
- Contextual criticality (business impact)
Example form: DRS = w1×Vulnerabilities + w2×ThreatIntel + w3×Activities + w4×Context. Apply DRS to drive automated containment, risk-based alerting, and prioritized investigations.How do we measure the effectiveness of AI in security with FPSR and AI-DA?- FPSR (False Positive Suppression Rate): measures reduction in false positives after AI adoption. FPSR = (FP_before − FP_after) / FP_before.
- AI-DA (AI-based Decision Accuracy): overall decision accuracy across TP, TN, FP, FN. AI-DA = (TP + TN) / (TP + TN + FP + FN).
Track alongside incident response time and alert prioritization to quantify operational benefit.Which cloud and network threat metrics should we track, and how do we improve them?- CTDA (Cloud Threat Detection Accuracy): correctness and efficiency of cloud-specific detections; improve via cloud-native telemetry, tuning rules, and better intel.
- ASI (Attack Surface Index): count/weight of internet-exposed assets/services; reduce by decommissioning unused services, hardening configurations, least privilege, segmentation, and WAFs. Use tools like Wazuh/Elastic and cloud-native controls (e.g., AWS GuardDuty, Config; Azure Defender, Policy).Which incident management metrics support proactive defense, and how do we estimate incident impact?- ATHSR (Advanced Threat Hunting Success Rate) = Successful Hunts / Total Hunts; indicates proactive detection of stealthy threats.
- IIE (Incident Impact Estimation) = Downtime Cost + Data Loss Impact + Recovery Costs; include regulatory, legal, restoration, and reputation effects. Use incident logs, financials, and operational inputs to model realistic impact ranges.How do we build a continuous improvement loop with RMV and MTP, and who should be involved?- RMV (Risk Mitigation Velocity) = Average time from detection to resolution; aim to shorten via automation, playbooks, and cross-team workflows.
- MTP (Mean Time to Predict): average lead time of forecasts; improve with better data quality, retraining, and model tuning.
Create a feedback loop owned by security, data science, and leadership: review metrics regularly, adjust controls/models, retrain, and realign to business risk priorities.
pro $24.99 per month
access to all Manning books, MEAPs, liveVideos, liveProjects, and audiobooks!



 Data-Driven Cybersecurity ebook for free
