9 Measuring what matters
This chapter argues that the purpose of measurement is to expose invisible problems in the delivery system, not to rank people or create impressive dashboards. By shifting attention from local activity to end-to-end flow, it shows how long work waits, where queues form, and why teams can feel busy while value still stalls. The core idea is simple: a metric is useful only if improvement in that number reflects a real improvement in the system. Otherwise, the number becomes noise, pressure, or a target to game.
The chapter then develops a practical set of Lean metrics for developers: lead time, cycle time, activity time, and activity ratio, along with operational measures such as deployment frequency, change failure rate, and MTTR. Each metric illuminates a different part of the value stream, and their real power comes from decomposition and comparison. Lead time versus cycle time reveals queue time before work begins, activity time exposes hidden waiting inside a station, and activity ratio shows how much of elapsed time is actual value-creating effort. Control charts and percentiles are used to distinguish normal variation from meaningful signals so teams can investigate unusual cases without overreacting to routine wobble.
The chapter also warns against vanity metrics and optimization traps, where improving the dashboard worsens the system underneath it. It emphasizes pairing speed metrics with guardrails so gaming becomes visible, and it extends the same logic to Kanban boards and flow dashboards: they should support learning, not surveillance. In practice, the chapter’s advice is hands-on and iterative: gather a small sample of real work items, calculate the metrics, identify the largest waiting states, run one improvement experiment, and measure again. The goal is not to hit a number, but to build a system that delivers value faster, more predictably, and with less waste.
A 23-day lead time decomposed. Active work accounts for roughly 3 days. The remaining 20 days are waiting.

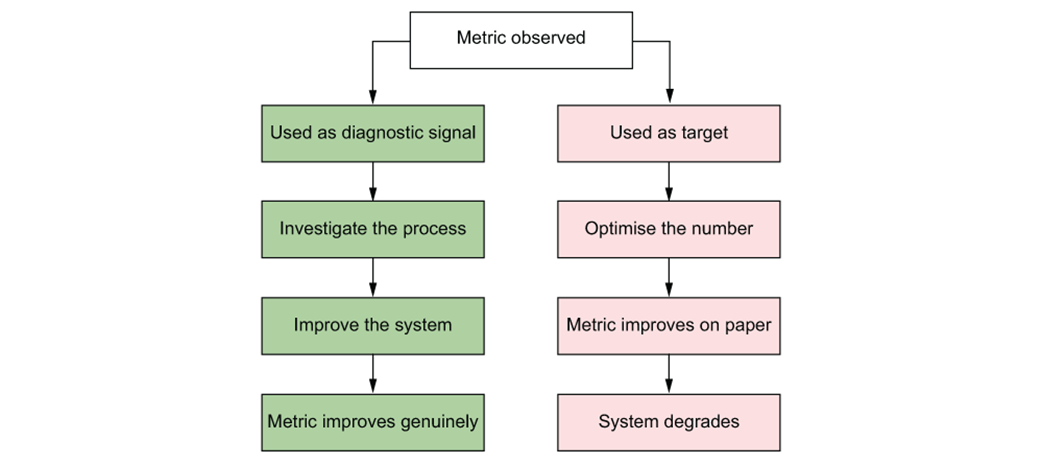
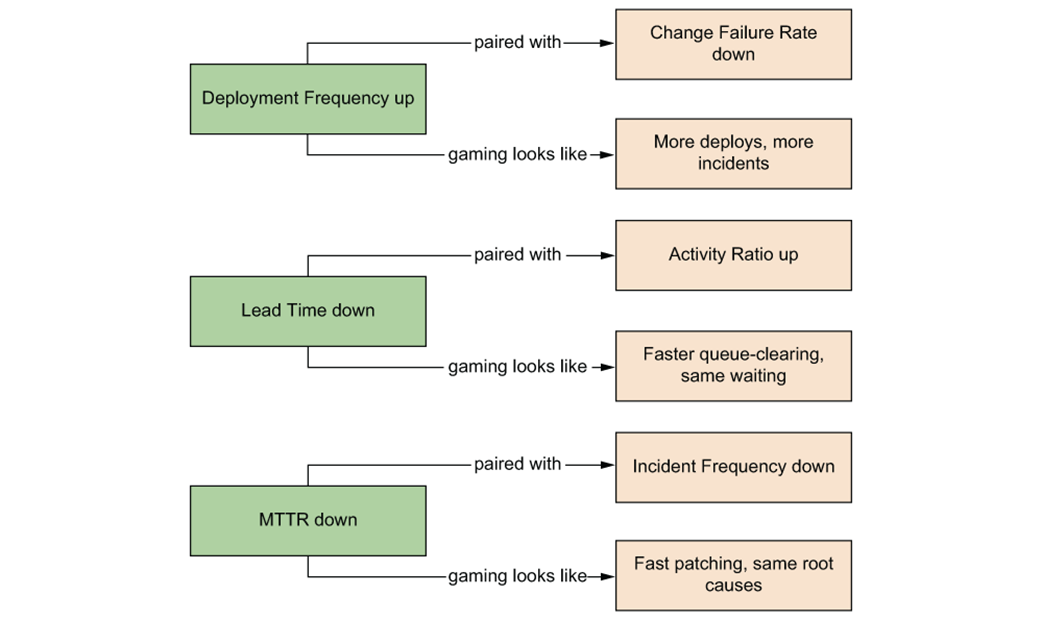
Every metric follows one of two paths. The left path improves the system. The right path games the number.
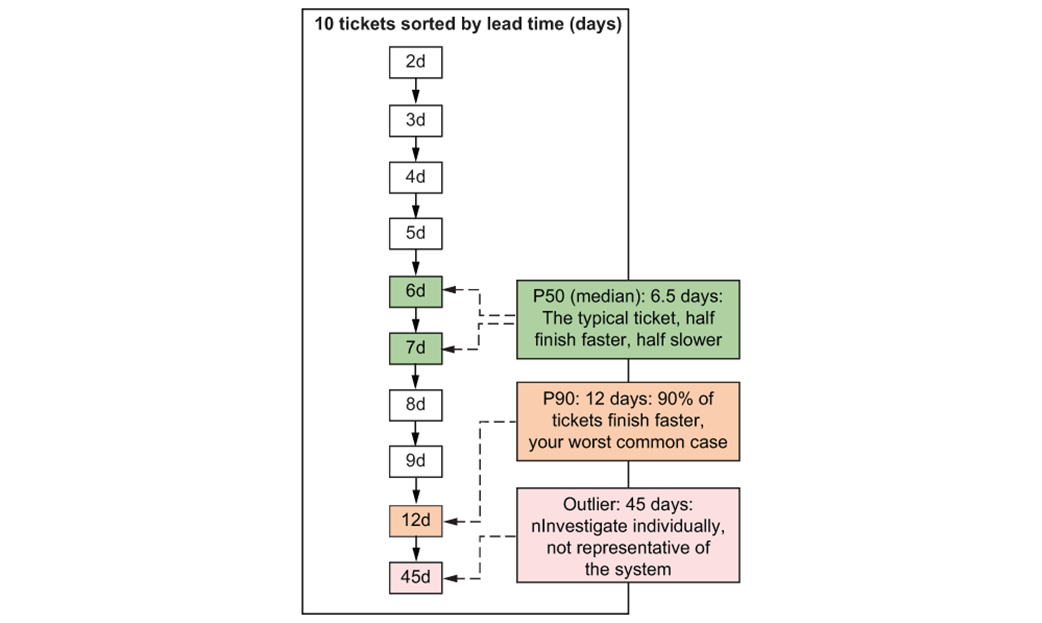
Ten tickets sorted by lead time. The median (p50) is the middle value, the point where half your tickets are faster, and half are slower.
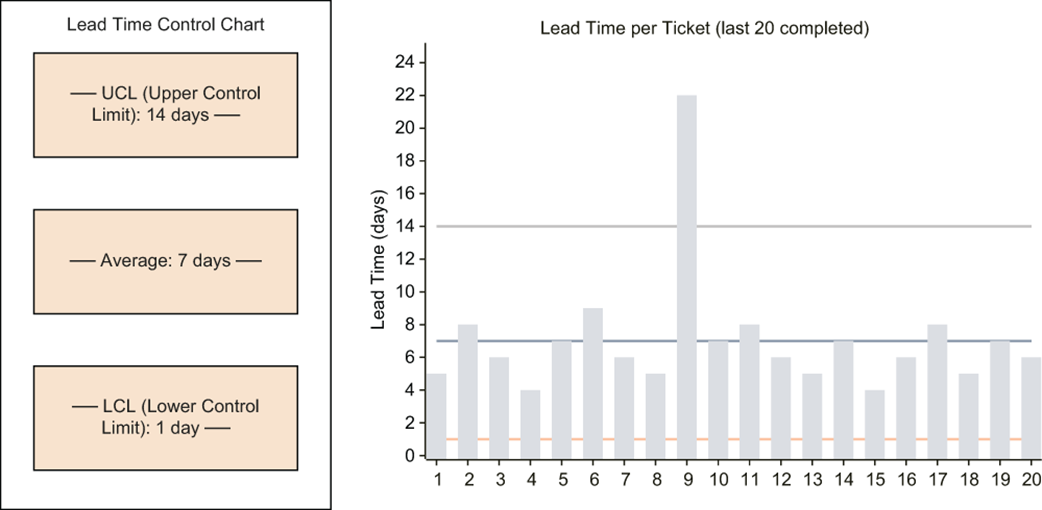
A lead time control chart. Ticket 9 breaches the upper control limit—that's a signal worth investigating, not a number to punish. The remaining tickets fall within the natural variation of the process.
Cycle time measures the span from when work started to when it is merged/deployed. Everything before "Work Started" is queue time, captured by lead time but not cycle time.

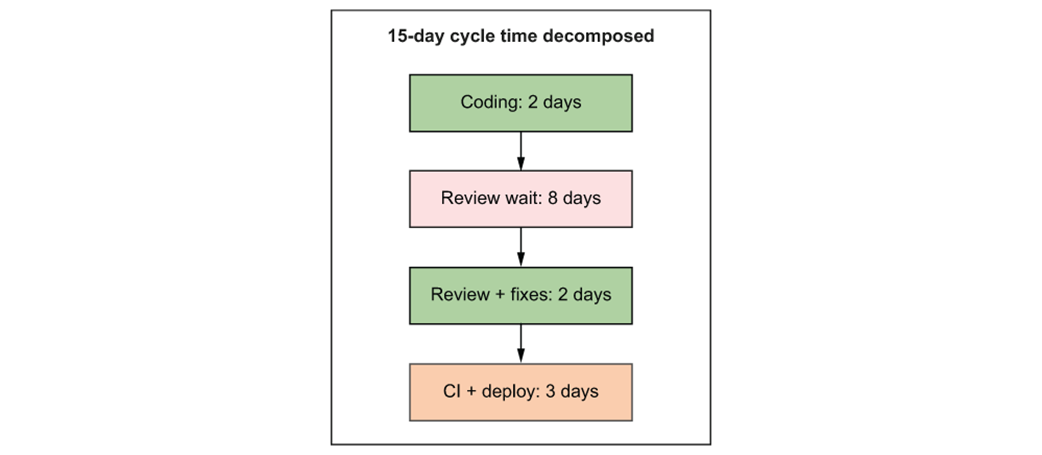
An outlier cycle time decomposed. The 8-day review wait is the dominant phase; that's the constraint, not coding speed.
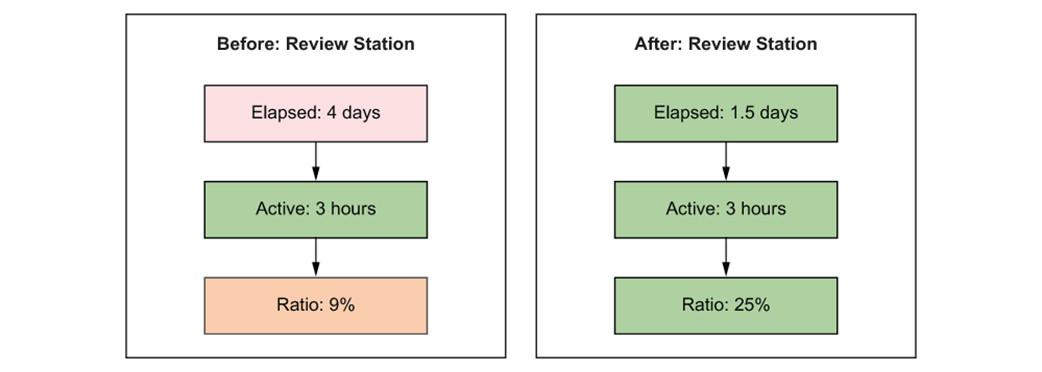
Activity time at the review station before and after introducing review windows.
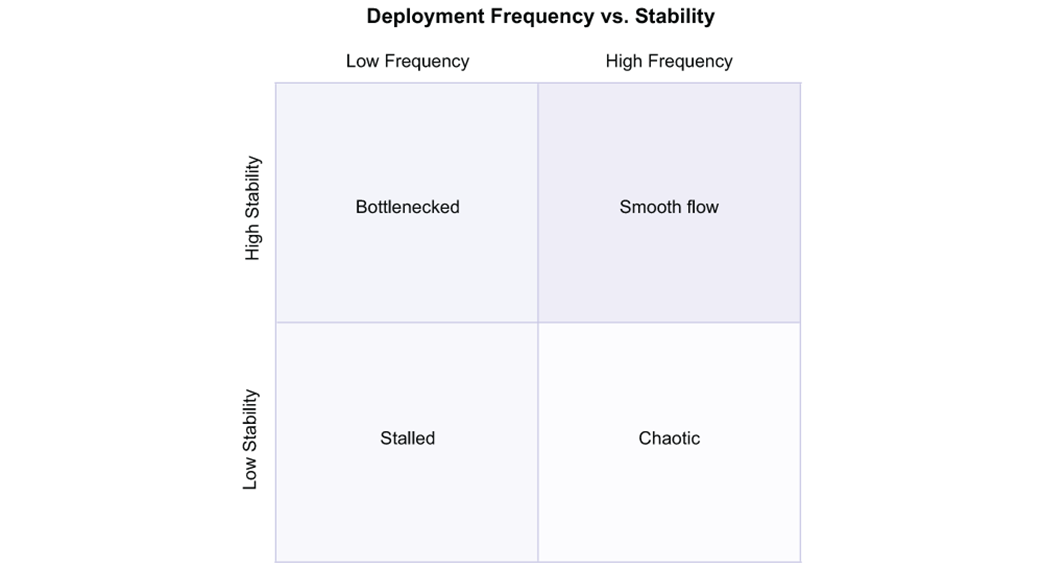
The four quadrants of deployment behavior.
Paired metrics expose gaming. If the speed metric improves but the guardrail degrades, someone optimized the metric, not the system
The typical three-column Kanban board. It answers one question: where is each ticket?

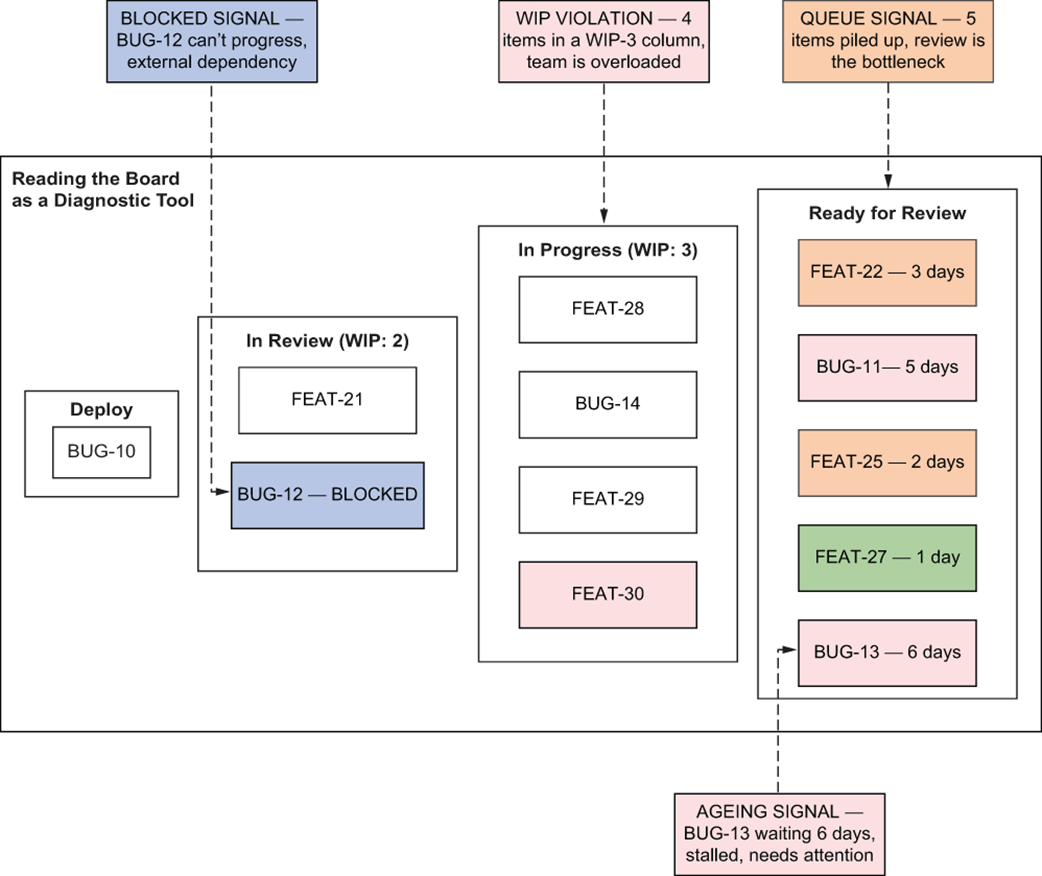
A dashboard Kanban board is read as a diagnostic tool. The Ready for Review section has five items, more than any other column, revealing a queue at the review station. Items can be color-coded by age. The queue, colors, and intention are visible at a glance.
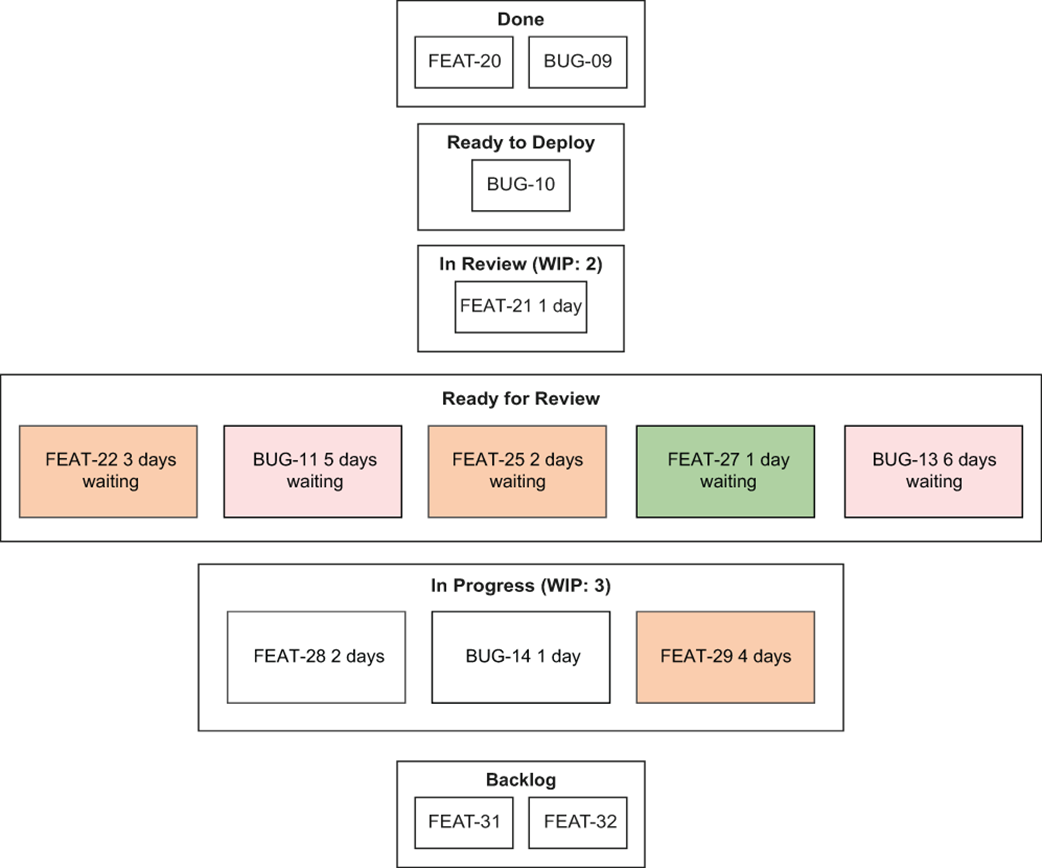
Four signals hiding in plain sight on a Kanban board.
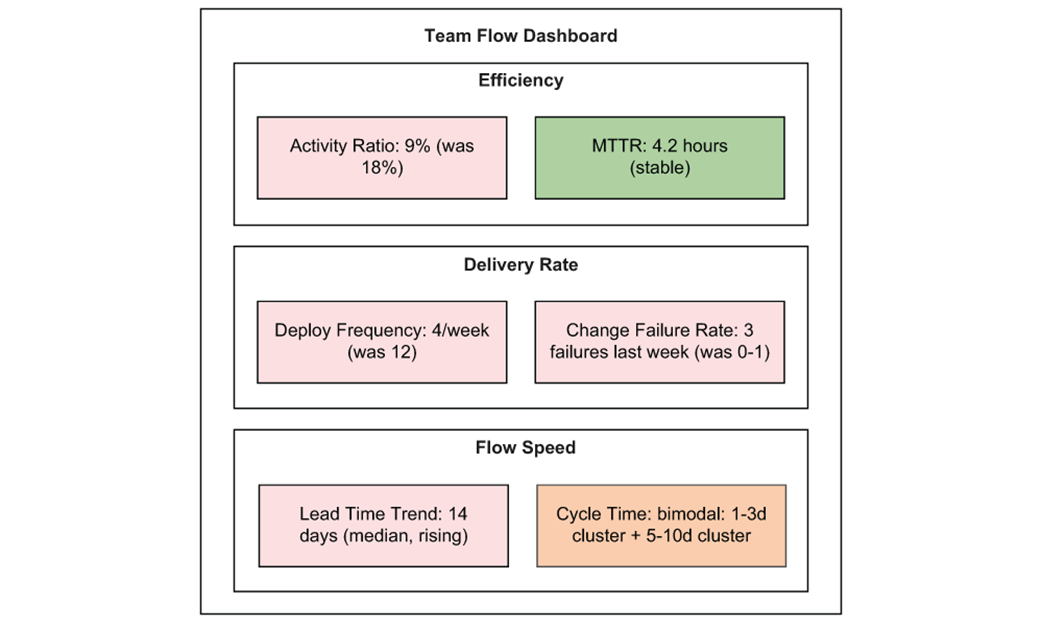
A minimal team flow dashboard. Six metrics, each answering a different question about system health.
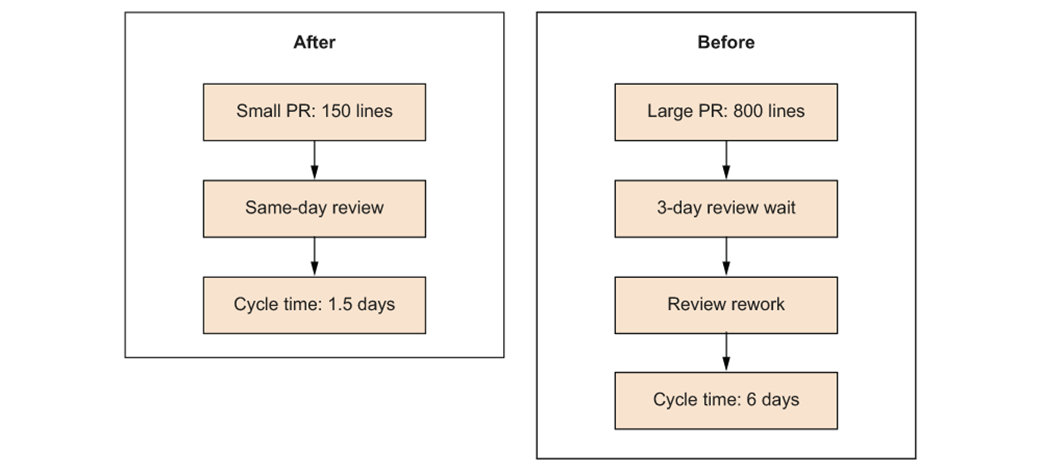
The effect of PR size reduction on cycle time. Smaller PRs reduce both review wait time and rework cycles.
Summary
- Lead time (P50/P90) tracks the duration from request to delivery, helping to identify where the system stalls.
- Cycle time measures the period from when work starts to when it is deployed, with the gap between this and lead time representing the queue.
- The activity ratio is calculated as active hours over elapsed time, and a ratio below 15% indicates that most of the time is spent waiting.
- Control charts plot metrics over time with set bounds, allowing teams to react only to significant outliers rather than normal variation.
- Guardrail pairs track speed and quality together, as speed metrics alone are prone to being gamed.
- Kanban boards should be used to analyze column depth, item age, and work-in-progress (WIP) to diagnose flow, rather than simply tracking individual tickets.
- Flow dashboards provide visibility into trends and distributions over weeks, which helps surface slow drifts in performance.
- When evaluating AI or other tooling, measure the impact on total lead time rather than individual station speed to identify the real system bottleneck.
FAQ
Why should a software team measure lead time instead of just how fast developers code?
Lead time measures the full journey from request to delivery, including backlog time, review, CI, deploy, and other waiting periods. It reveals the customer’s real experience and exposes system friction that coding speed alone cannot show.
What is the difference between lead time and cycle time?
Lead time starts when a request enters the system and ends when it reaches production. Cycle time starts when work actually begins and ends at completion. The gap between them shows how long work waits before anyone touches it.
Why is activity ratio important?
Activity ratio is activity time divided by cycle time. It shows how much of the elapsed time is spent doing real work versus waiting. A low ratio usually means the system has too much queue time or process overhead.
Why can using metrics for ranking people be harmful?
When metrics are attached to individual performance reviews or rankings, people tend to hide problems, avoid risky work, and game the numbers. Metrics are most useful when they help teams learn about the system, not judge individuals.
What is the optimization trap?
The optimization trap happens when a team improves a metric without improving the system. For example, reducing build time by removing tests may make the number look better while increasing defects and making delivery worse overall.
What are control charts used for?
Control charts help teams distinguish normal variation from special-cause signals. They show when a work item is outside the natural limits of the process and deserves investigation, instead of reacting to every small fluctuation.
How can activity time help diagnose bottlenecks?
Activity time shows how much time inside a station is spent actively working versus waiting. If a station has many elapsed days but only a few hours of active work, the hidden queue is likely the real bottleneck.
Why are paired metrics better than single metrics?
Paired metrics add a quality guardrail to a speed metric, making gaming easier to detect. For example, deployment frequency should be read together with change failure rate so teams cannot ship faster by simply shipping worse software.
What makes a metric a vanity metric?
A vanity metric goes up and to the right without correlating to real value delivery. Examples include lines of code, commit count, or raw story points completed. These numbers can improve while the system gets worse.
How should a team use Kanban boards and dashboards for continuous improvement?
A Kanban board should be used as a live diagnostic tool, not just a ticket tracker. Dashboards should show trends, distributions, and the effects of experiments so the team can spot queues, stalls, and improvements at a glance.

 Build High Value Software Systems ebook for free
