7 Unsupervised Learning: Repurposing Drugs, Curating Compounds, & Screening Fragments
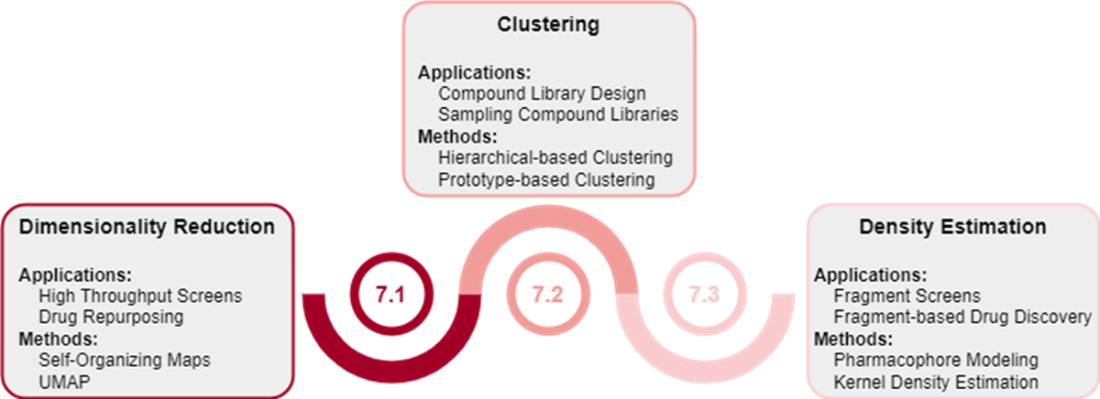
Unsupervised learning is introduced as a practical way to extract structure from the large pools of unlabeled data common in drug discovery. The chapter frames this as especially valuable for expensive life-science experiments, where the goal is not to predict a known label but to uncover hidden patterns, compress high-dimensional representations, and reveal groups or distributions that can guide decisions. Using COVID-19 antiviral discovery as the running example, it shows how unsupervised methods can support three key tasks: visualizing screening data, designing diverse compound libraries, and reasoning about fragment hits for lead discovery.
The first part focuses on dimensionality reduction for drug repurposing, starting with high-throughput screening data from the COVID Moonshot campaign. The text explains how molecules are featurized with Morgan fingerprints, then projected into lower-dimensional spaces with self-organizing maps and UMAP. SOMs are presented as a topology-preserving grid that can organize compounds into similar regions and highlight clusters enriched for active or inactive compounds, while UMAP is shown as a more flexible manifold-learning method that better preserves local neighborhood structure. These visualizations are used to suggest candidate repurposing hits, while also emphasizing the limits of retrospective enrichment and the need to avoid mistaking unsupervised structure discovery for true predictive validation.
The remaining sections show how unsupervised learning helps curate compound libraries and support fragment-based drug discovery. For library design, the chapter contrasts broad diversity with focused exploration, then describes combinatorial and retrosynthetic approaches for generating candidate molecules before applying clustering or dissimilarity-based selection to choose representative subsets. Agglomerative clustering and Taylor-Butina clustering are compared, with the latter favored for fingerprint-based chemical similarity because it better enforces explicit neighborhood constraints and yields less redundancy. Finally, density estimation is applied to fragment screening: pharmacophoric features are extracted from fragment hits, pairwise distance distributions are modeled with kernel density estimation, and unseen molecules are scored by how well their pharmacophore geometry matches the learned distributions, providing a probabilistic route from weak fragment binders toward more promising leads.
Roadmap of topics that we’ll cover across this chapter.
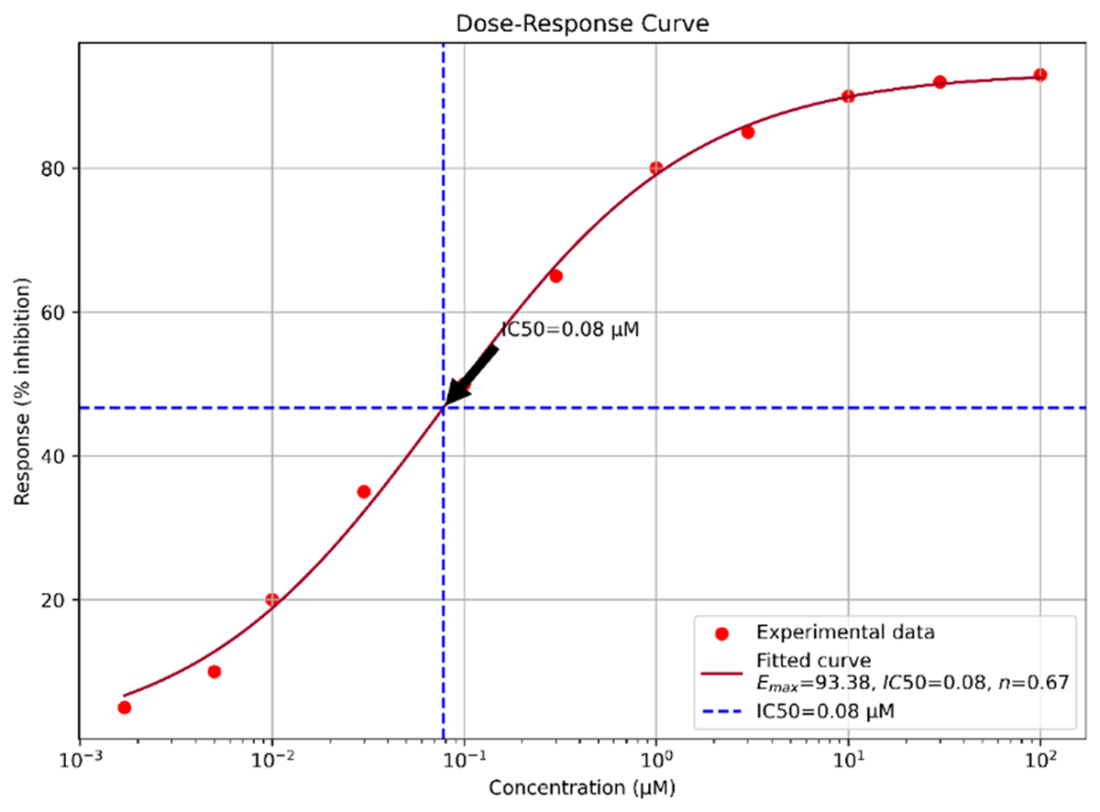
Example of a dose response curve on arbitrary data.
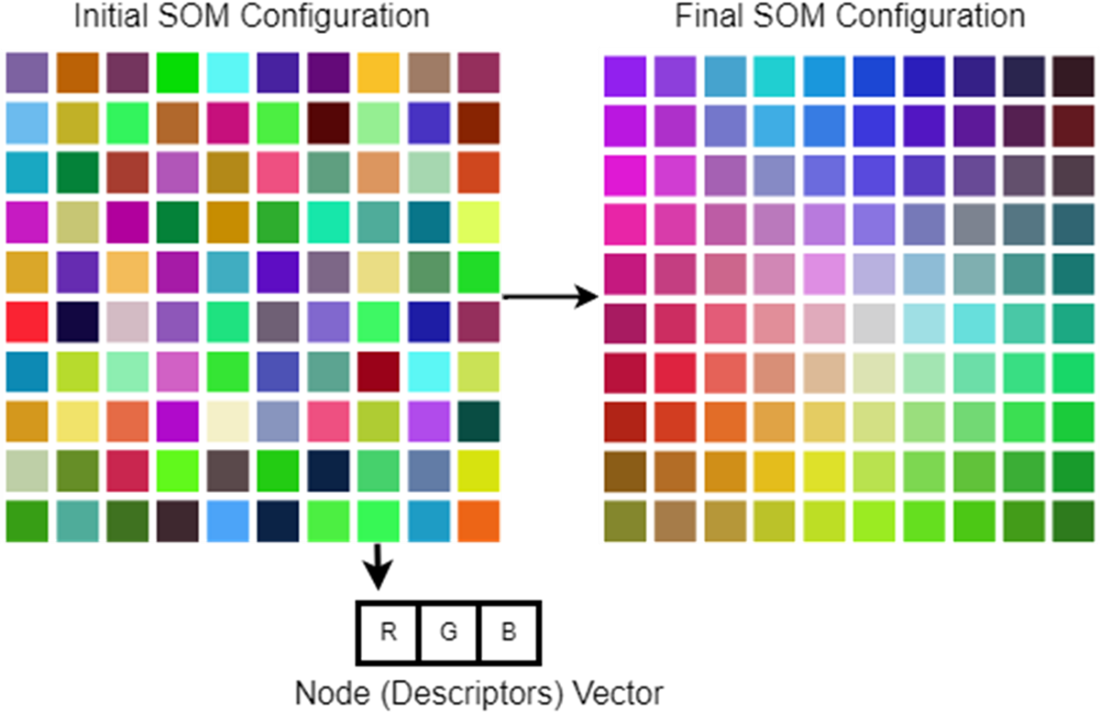
Over many iterations of node updates, the grid will self-organize such that similar nodes are close together and dissimilar nodes are far apart. Though we visualize the grid in 2D, each node carries its own weight vector whose dimensionality matches the input data—three dimensions in this RGB toy example, but 2,048 dimensions for the Morgan-fingerprint compounds. Only the grid layout is low-dimensional; the underlying molecular fingerprints remain high-dimensional vectors.
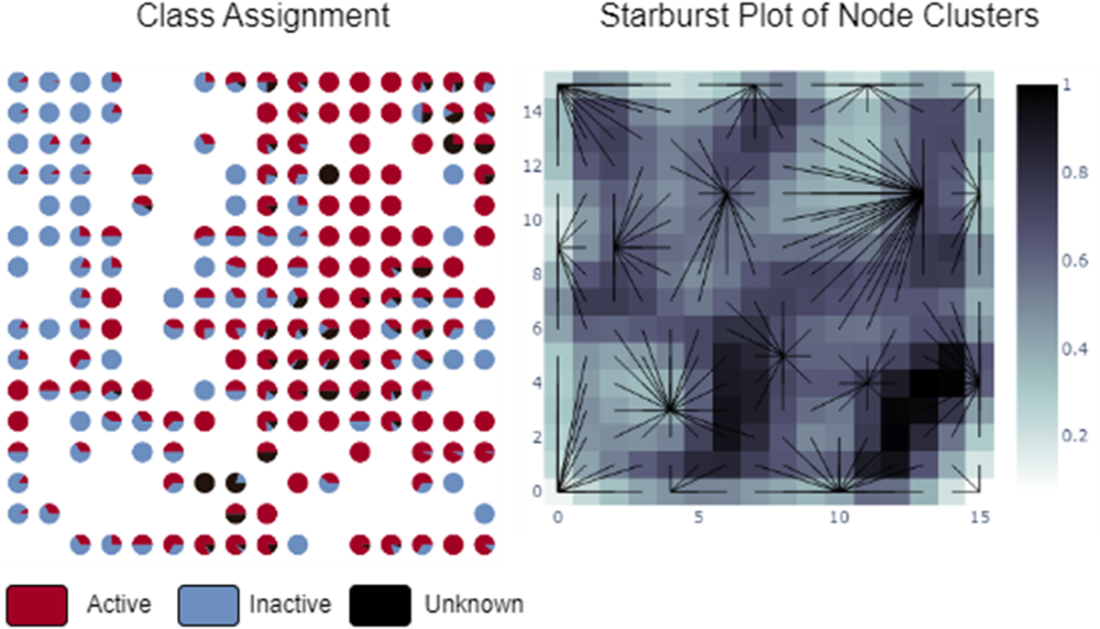
(Left) Visualize the proportion of compounds per class that reside in a specific node. We observe that nodes in the top right and top left quadrants are most enriched for active and inactive compounds, respectively. (Right) The UMAT represents the average distance between a node and its neighbors by color: areas with lighter colors (lower values) indicate that the nodes are close to each other, suggesting a cluster of similar data points that preserves the topology of the high-dimensional training data.
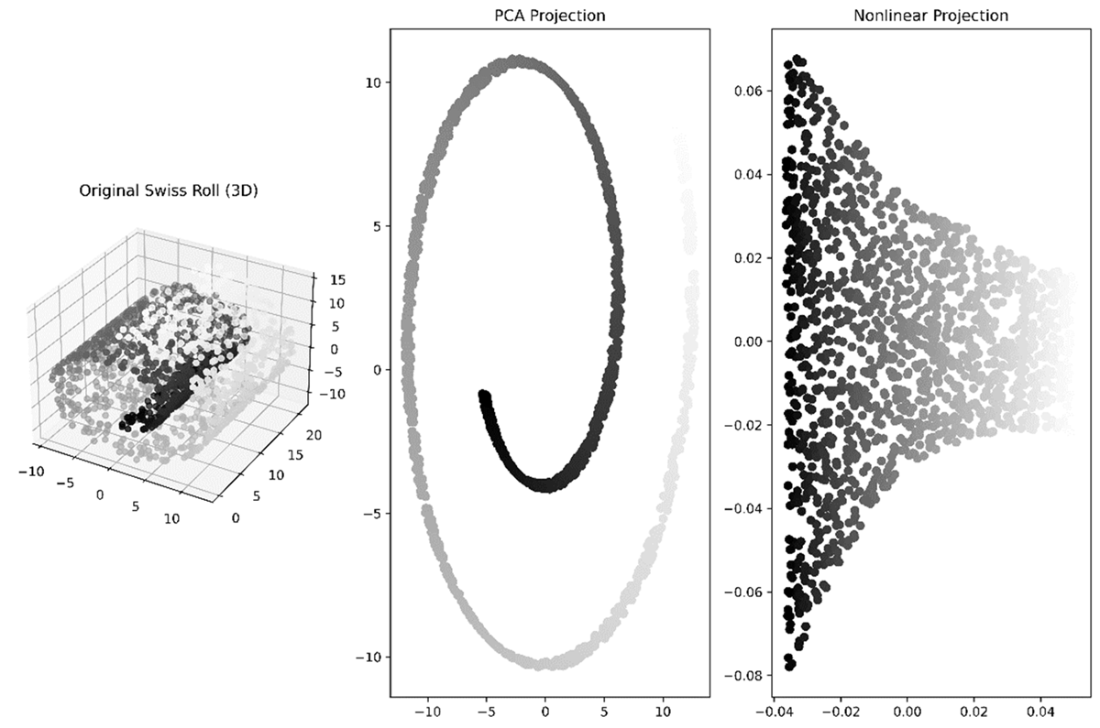
Comparison of PCA to a more complex manifold learning algorithm on the Swiss Roll data set.
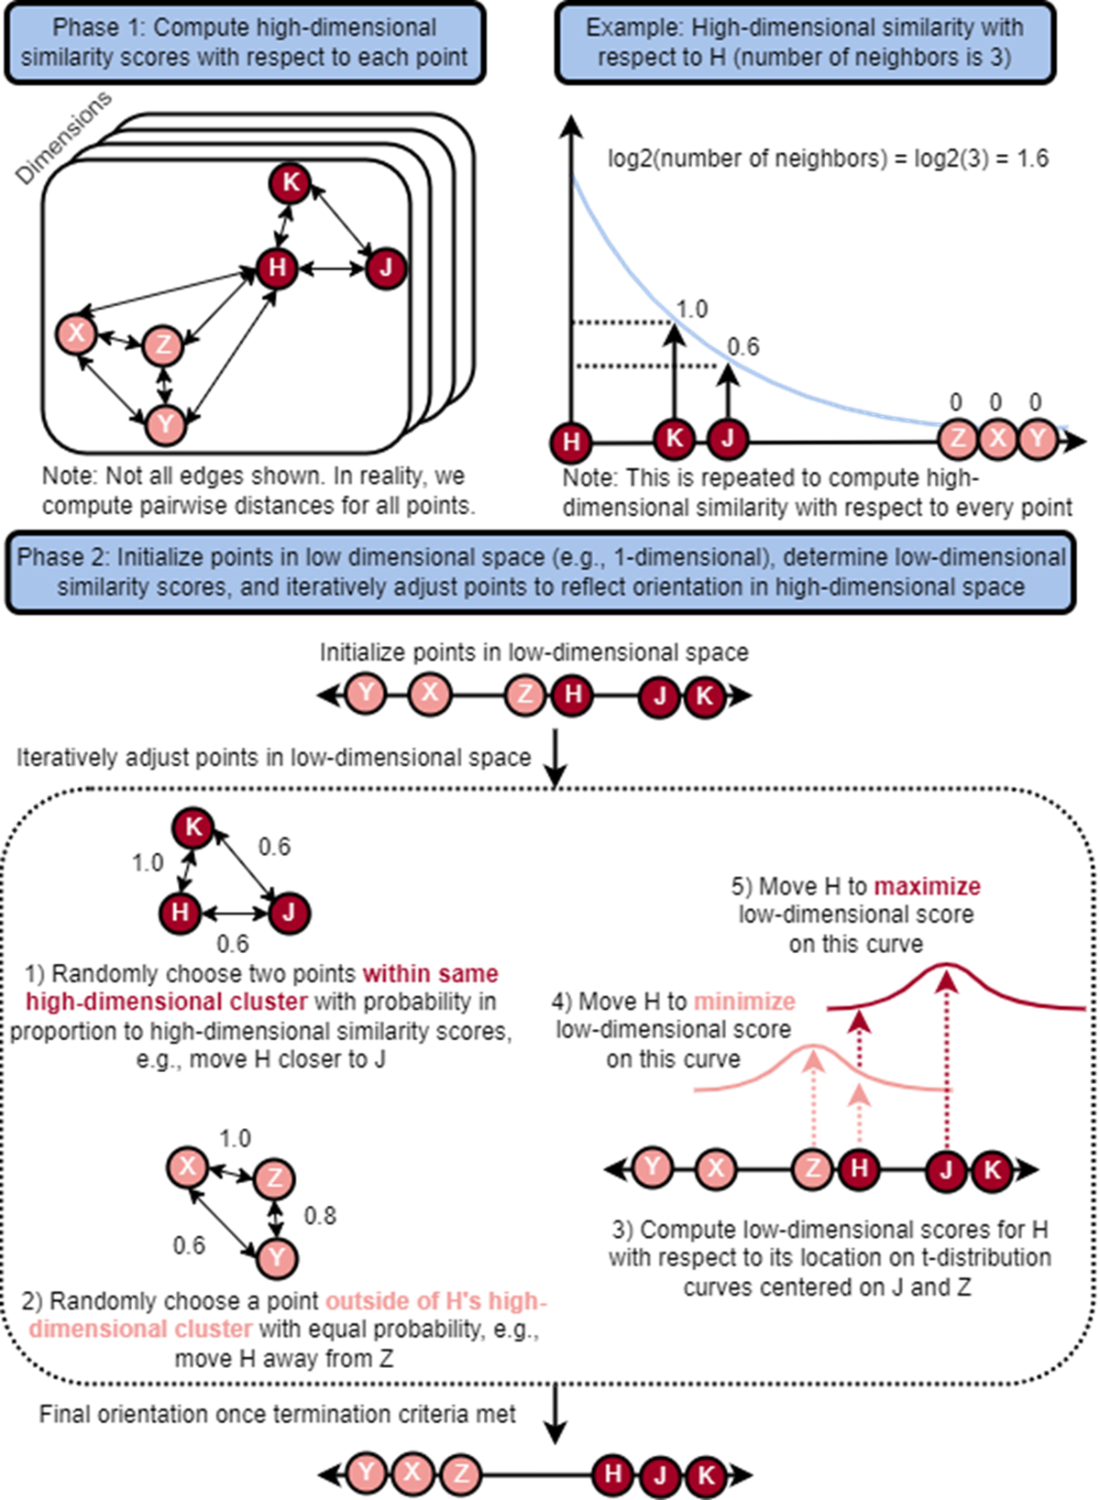
UMAP develops an understanding of local relationships by calculating the distances between each pair of points in high-dimensional space, and using these as the basis for high-dimensional similarity scores that are used to move low-dimensional projects of the points closer or further from one another.
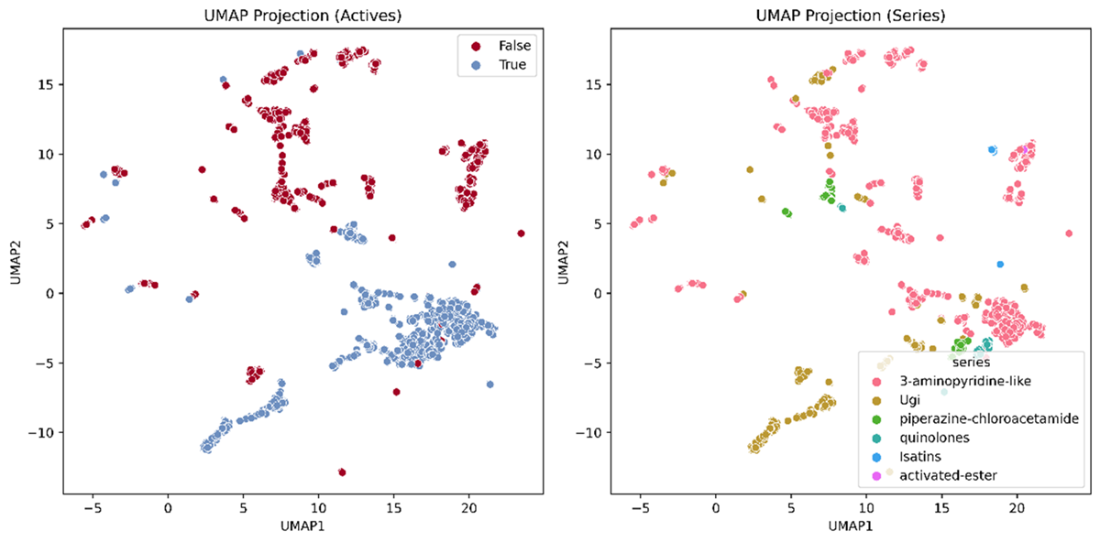
UMAP projection across each COVID Moonshot compound’s activity (left) and chemical series designation (right).
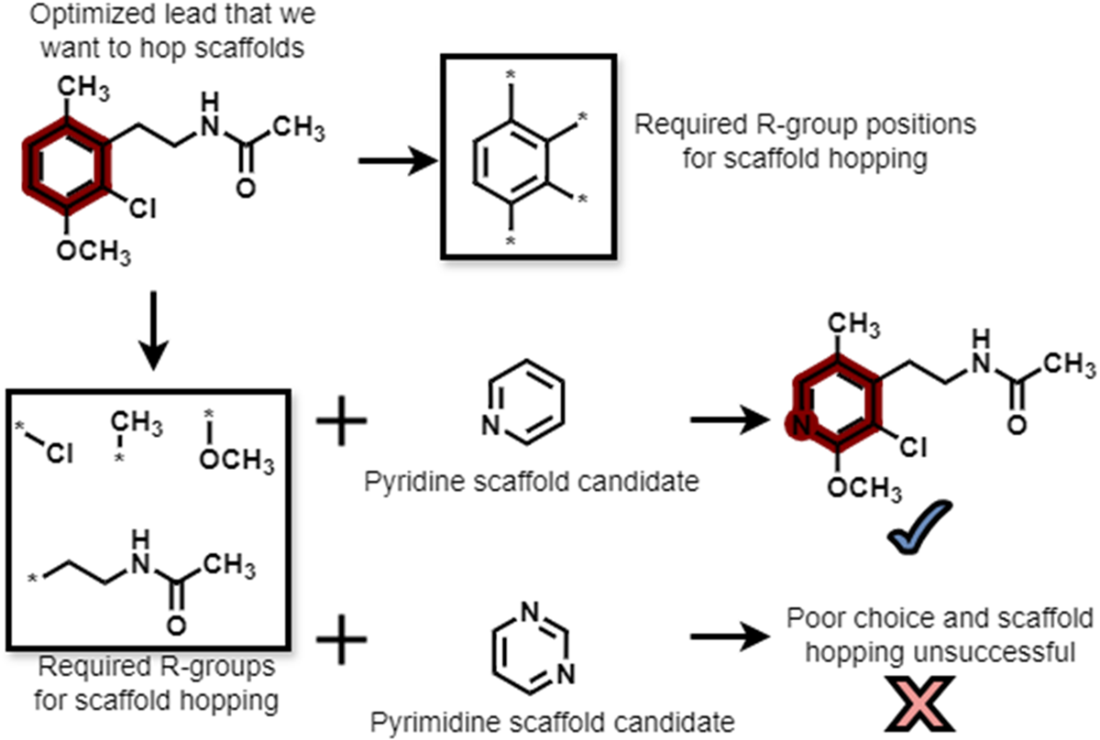
Scaffold hopping requires identifying a new scaffold that can bear the required R-groups in the appropriate relative positions. Replacement of the benzene ring with a pyridine ring would give a similar structure, but a pyrimidine scaffold would not work since the two nitrogens won’t accommodate the necessary R-group orientation.
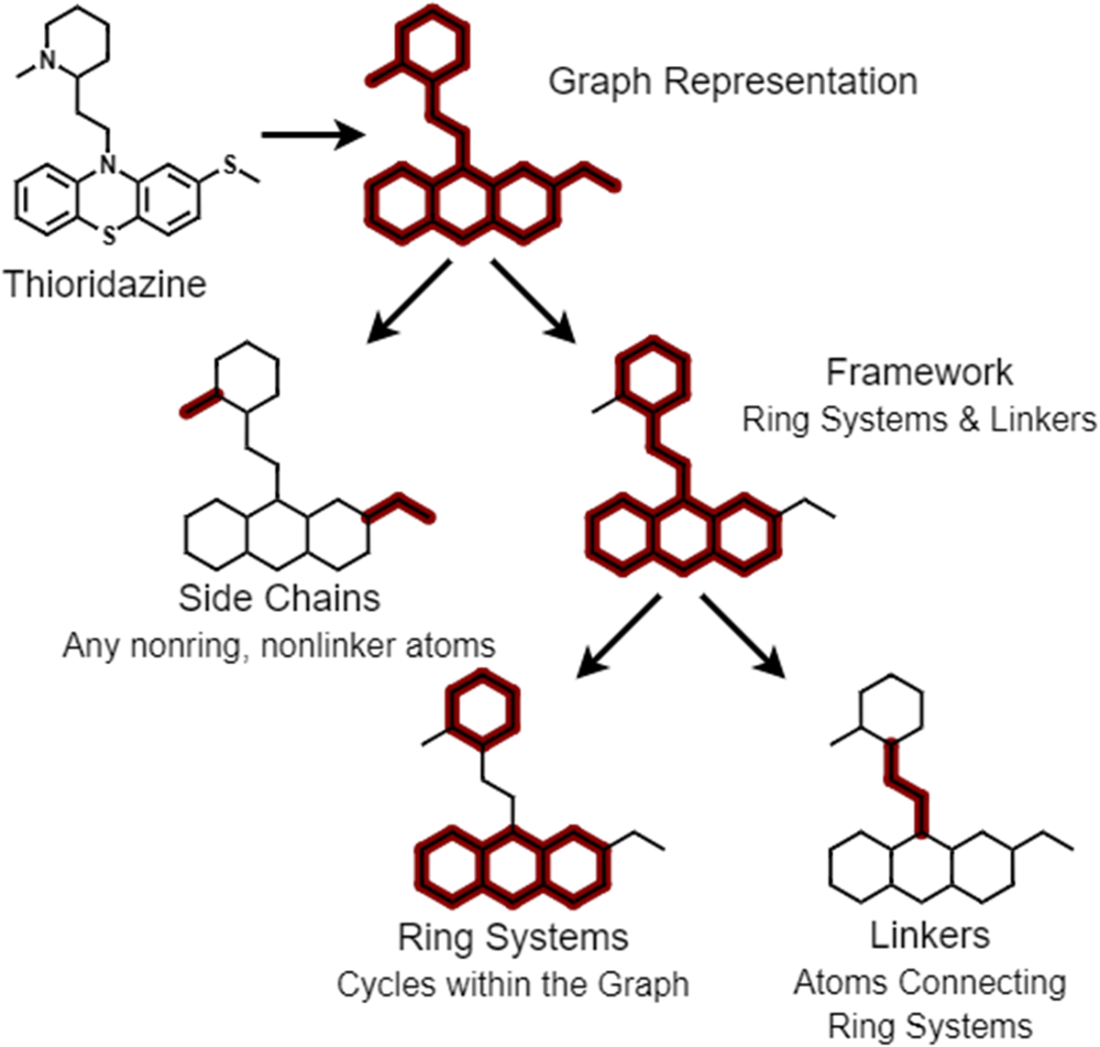
Hierarchical decomposition of a compound into various components and levels of abstraction.
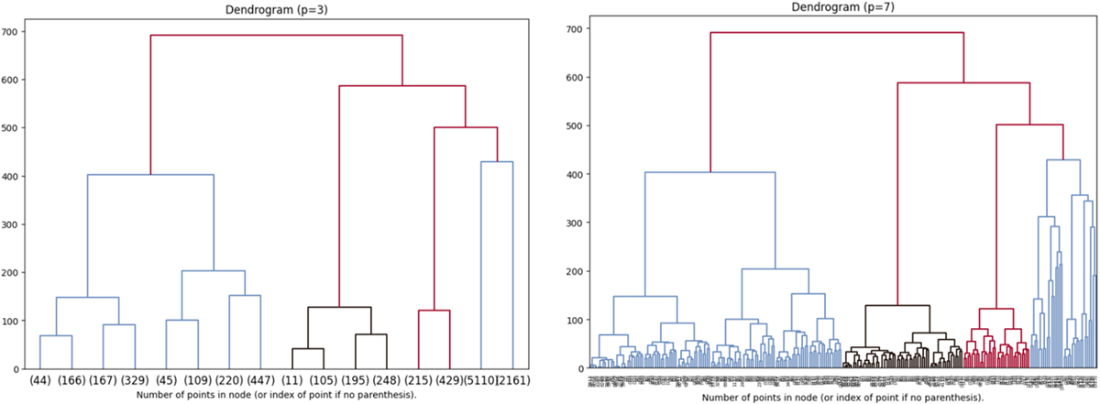
Dendrogram of the same agglomerative clustering fit but with different levels of truncation.
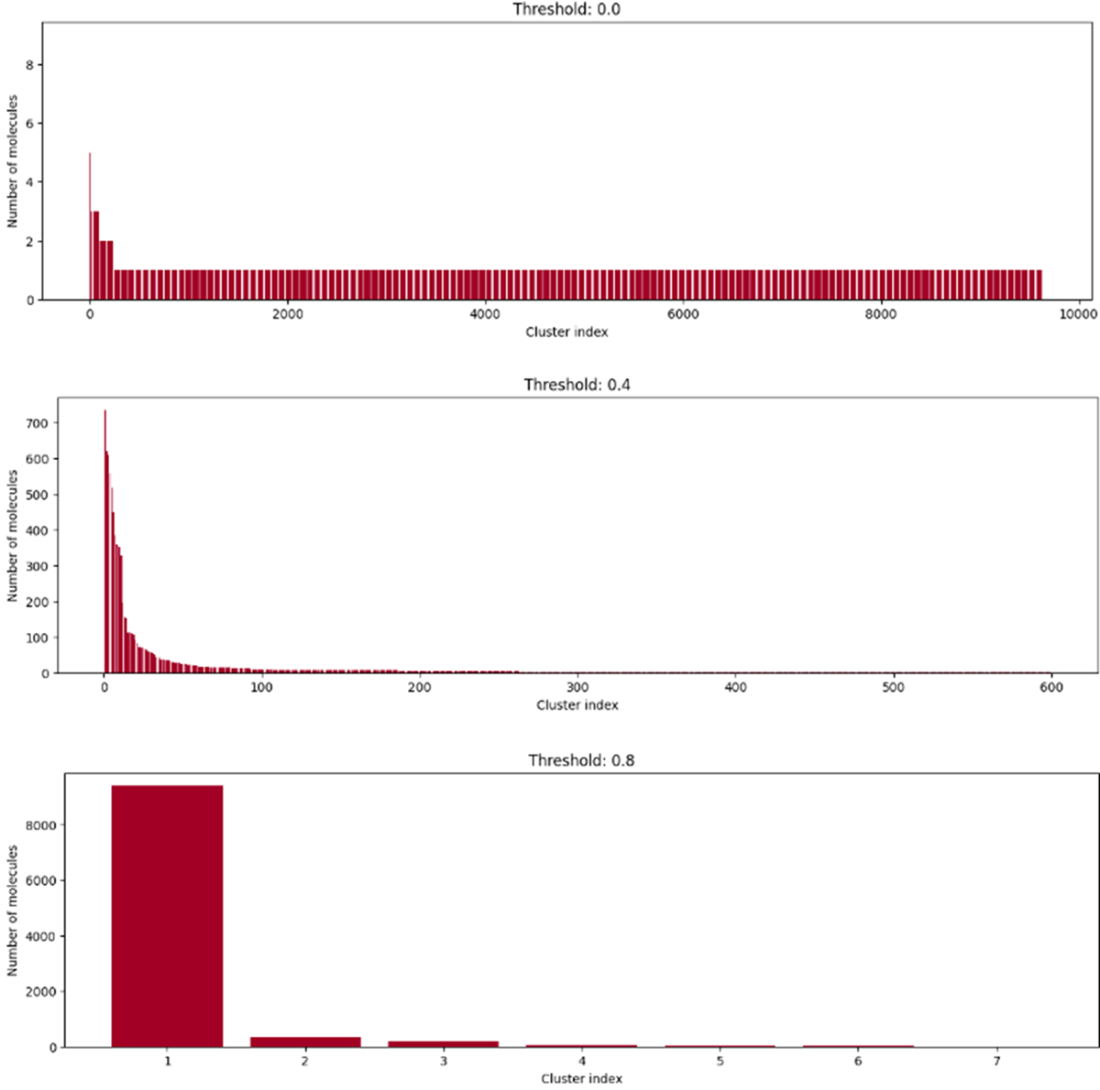
Distribution of number of molecules in each cluster at different neighbor thresholds.
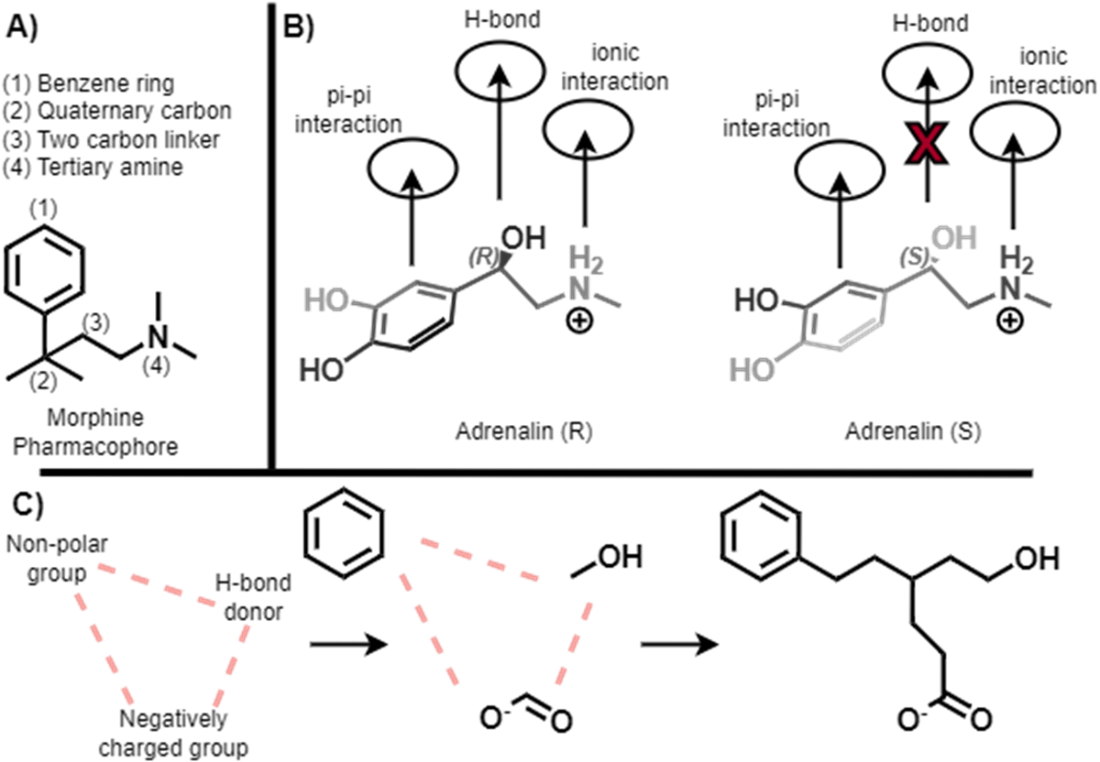
A) Morphine pharmacophore. B) Pharmacophore-based explanation for discrepancy in biological effects of adrenaline stereoisomers. C) Example pharmacophore features separated by a certain distance, which we can satisfy by selecting the shown functional groups and linking them to preserve desired spacing.
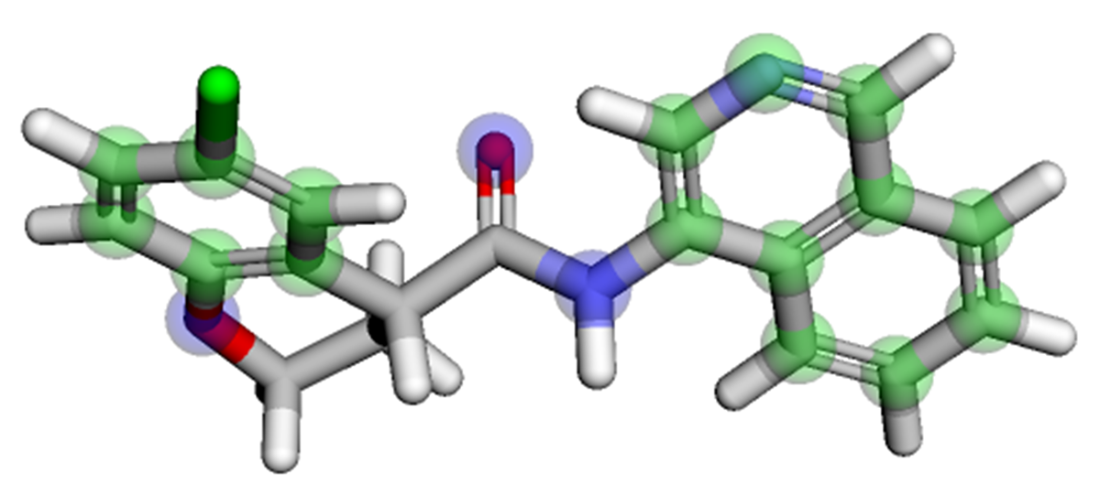
3D pharmacophoric features (H-bond donors in red, H-bond acceptors in blue, aromatics in green) for one possible conformer sampled from an arbitrary molecule.
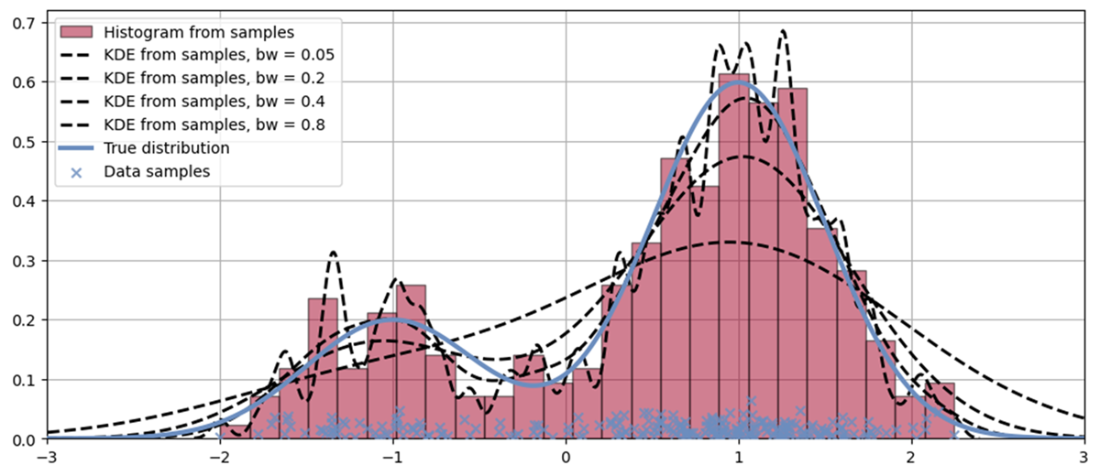
Comparison of histogram and kernel density estimation on a bimodal distribution.
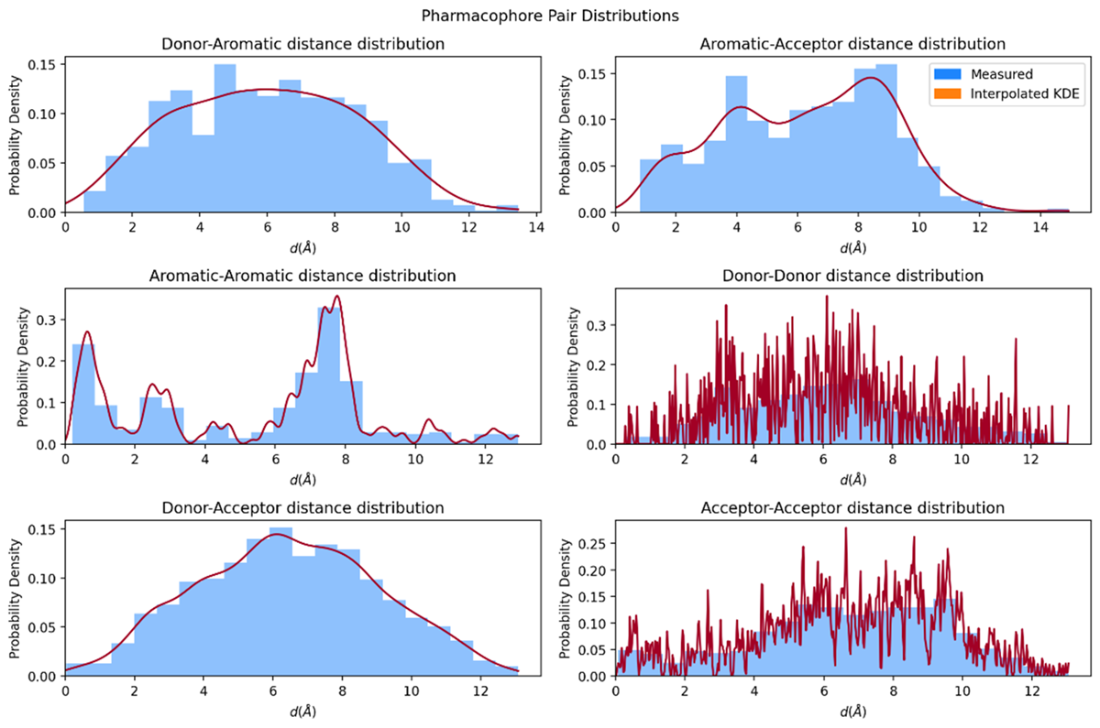
Fitted density estimates of pharmacophore pair distributions.
Summary
- Dimensionality reduction makes data more manageable for visualization, preserves features that provide important signal and throws away those that are unimportant or noisy, compresses the data into a form that is easier to use, and counteracts the curse of dimensionality. Examples include self-organizing maps and uniform manifold approximation & projection.
- Drug repurposing identifies new therapeutic uses for existing drugs that are outside the scope of their original medical indication. Repurposed drugs have already passed several stages of clinical testing and have well-documented safety profiles, streamlining the regulatory approval process while expanding therapeutic options available to patients with previously unmet medical needs.
- Clustering segments the data into similar subsets (where each subset is a cluster). The clustering model learns its own definition of classes, such that each cluster corresponds to a different class, and it learns which cluster to assign to each data instance.
- Diversity and focus play fundamental roles in the design of compound libraries. Two approaches to compound library design include combinatorial library design and retrosynthetic library design.
- Density estimation recapitulates the underlying probability density function that describes the process that generated our data set. Applications of density estimation include novelty and anomaly detection.
- Compared to the traditional approach of screening against a compound library to identify hits and optimize those hits into leads, the fragment-based approach screens against a fragment library to identify multiple fragments with binding affinity to a target. Once fragments are identified, they are expanded, merged, and optimized to yield lead compounds with stronger binding profiles.

 Build AI Drug Discovery Pipelines ebook for free
