6 Case Study: Small Molecule Binding to an RNA Target
Small molecules that bind RNA offer a promising way to modulate disease-relevant biology, but the problem is difficult because RNA targets are flexible, chemically repetitive, and often poorly characterized by high-resolution structures. To address that challenge, the chapter builds a QSAR workflow around the HIV-1 TAR RNA system, using a small set of experimentally measured ligands to relate molecular structure to binding behavior. The overall aim is not only to reproduce a published study, but also to show how predictive modeling can help identify the structural features that matter most when designing RNA-active compounds.
The workflow begins with careful molecular representation, expanding each ligand into relevant protonation and tautomeric states and sampling conformers to capture 3D flexibility. Because the data set is small, the chapter emphasizes thoughtful descriptor handling: redundant features are removed, response variables are log-transformed, and representative train-test splits are created with the Kennard-Stone algorithm after dimensionality reduction with PCA. These steps are used to keep the model space manageable while preserving diversity in both chemical structure and binding response, which is especially important when working with only dozens of compounds.
For modeling, the chapter first follows a transparent QSAR approach with Lasso-based feature selection and multiple linear regression, then expands to gradient boosting for a more powerful tabular-data baseline. It also devotes substantial attention to interpretation, showing how coefficients, feature importance, sensitivity analysis, partial derivatives, and SHAP values can explain what drives predictions at both global and local levels. The broader message is that RNA-targeted small-molecule discovery benefits from a balance of predictive performance and interpretability, since both are needed to guide design decisions in a low-data, high-uncertainty setting.
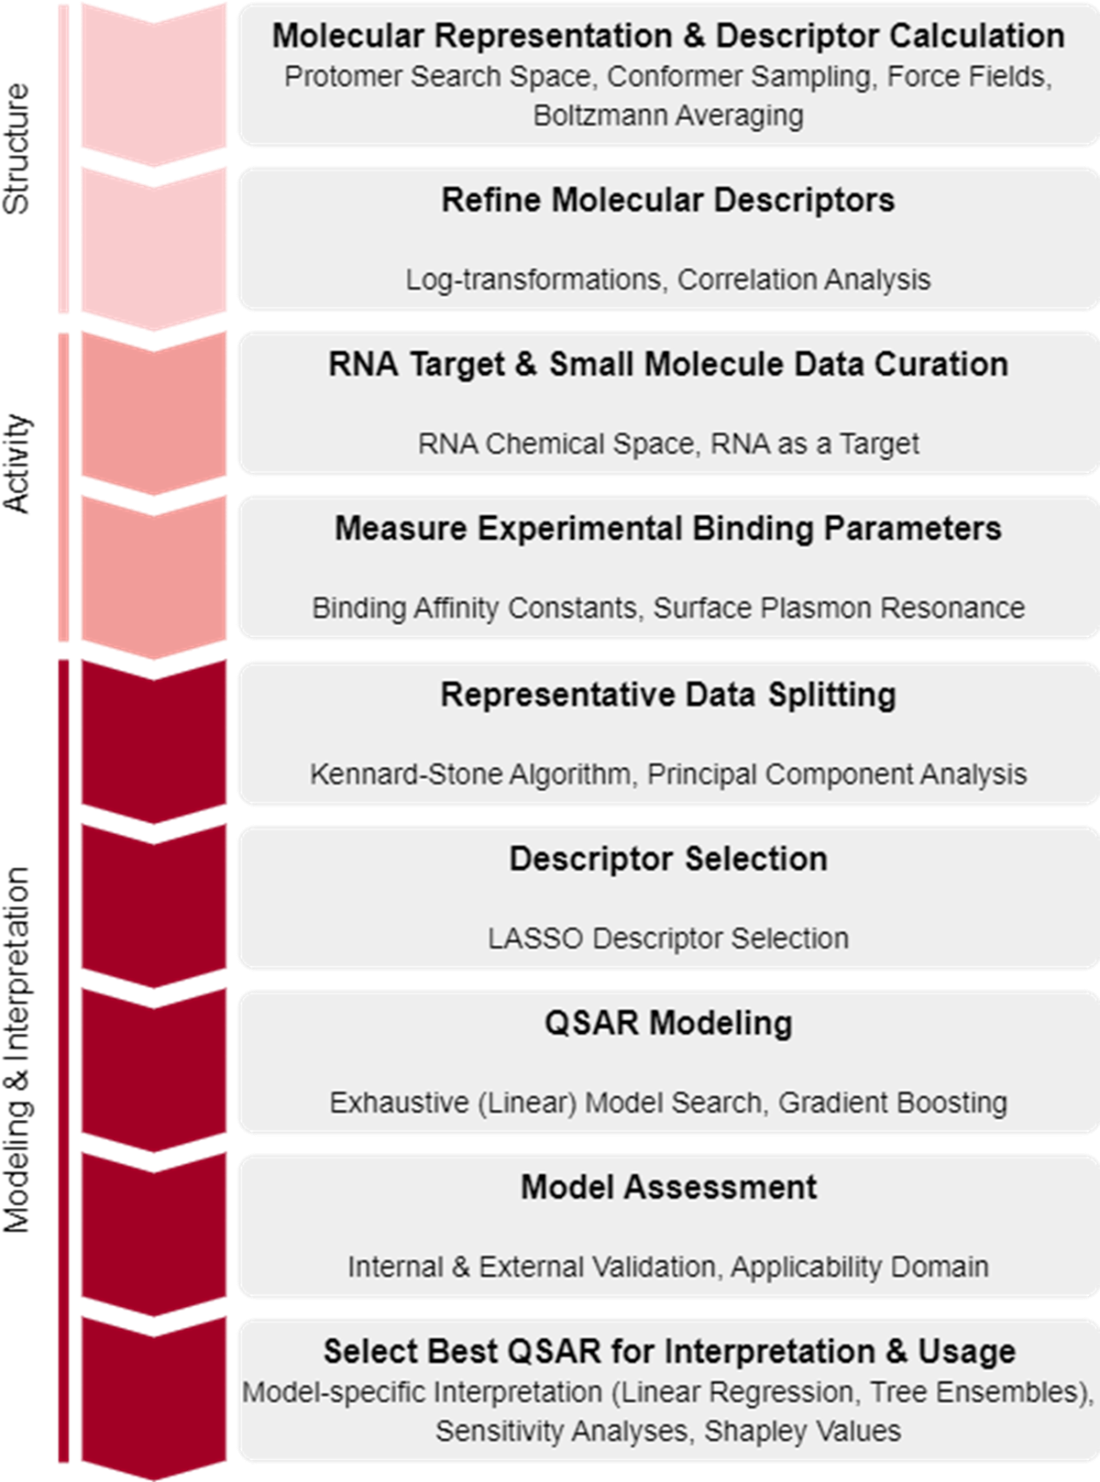
The general structure of our QSAR pipeline and major concepts we’ll cover along the way.
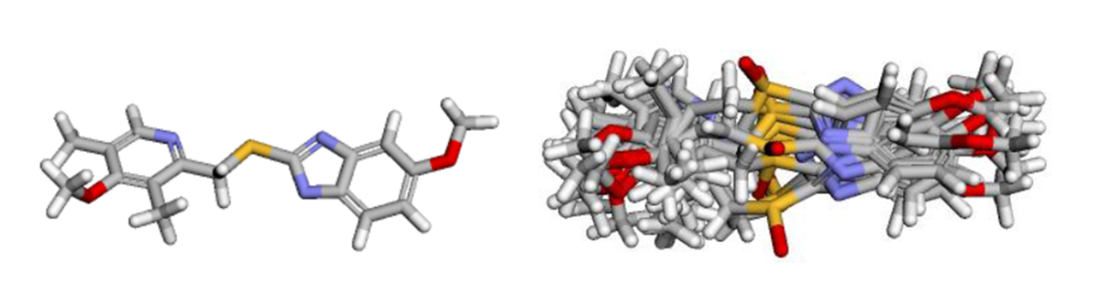
(Left) 3D illustration of the drug esomeprazole. (Right) We generated 10 conformers of esomeprazole and overlaid them on top of each other, demonstrating the broad spatial range that a molecule’s structure can inhabit.
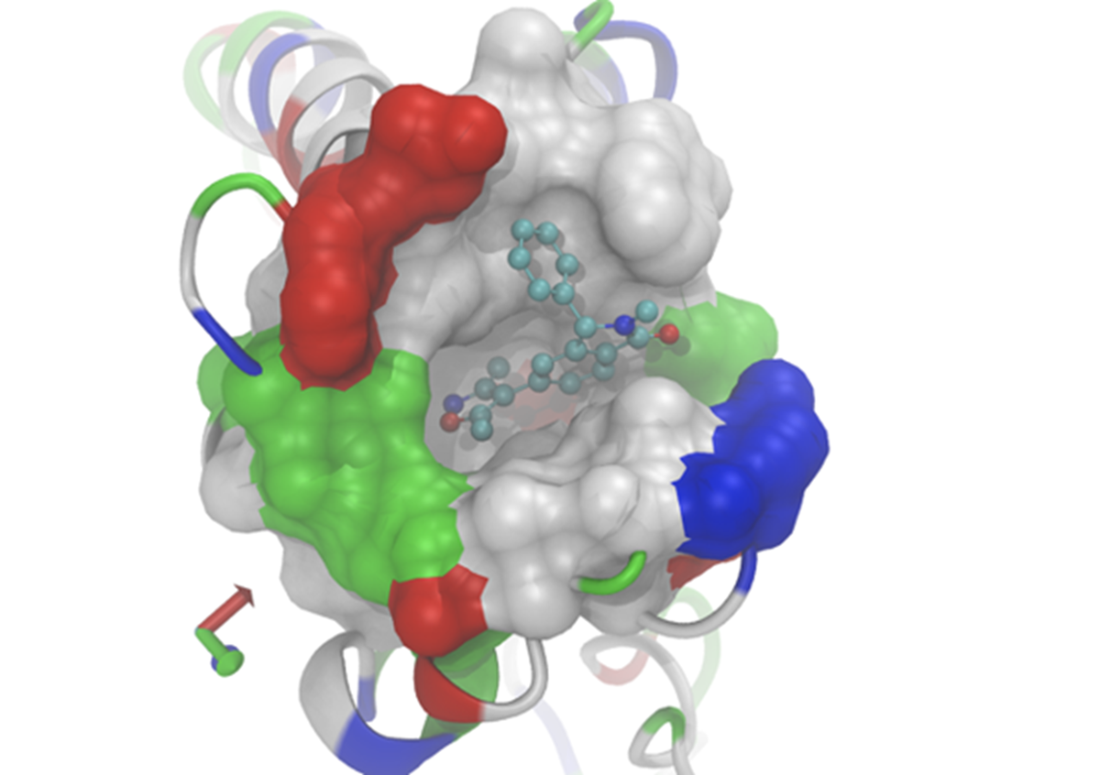
Example of one binding configuration between a small molecule and a protein region. Spatial arrangements differ in energy level, and the molecule’s optimal energy states may result in propensity towards different 3D arrangements with corresponding differences in binding affinity to the same region of a target.
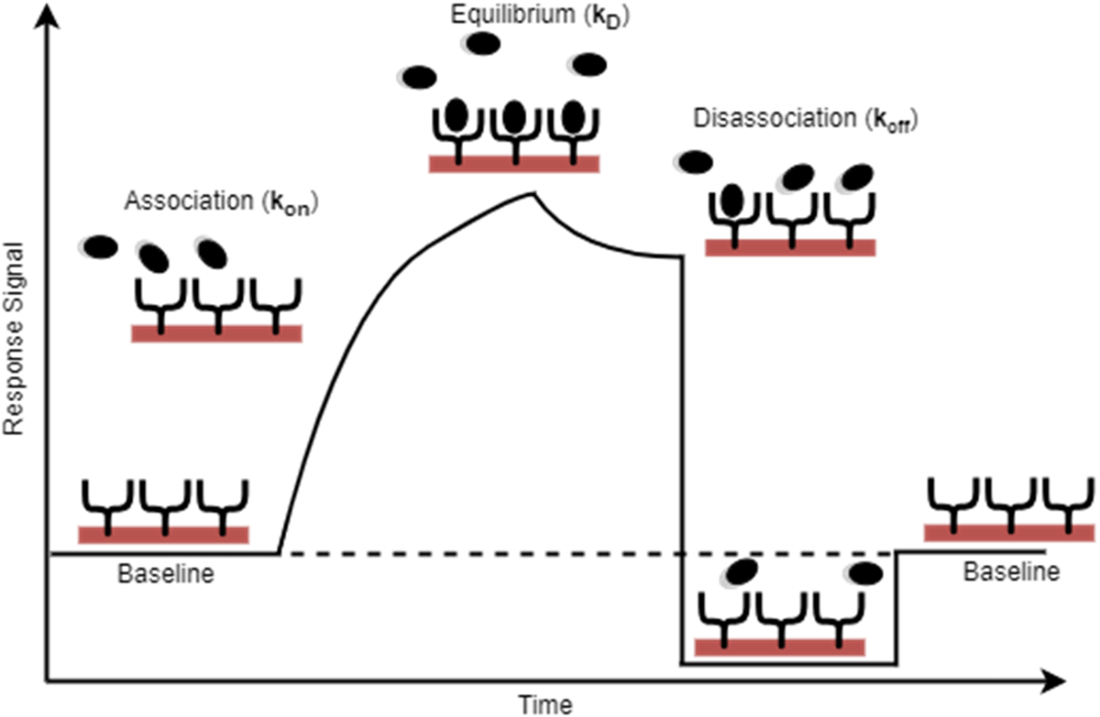
Surface plasmon resonance (SPR) plot of response signal to time, and how changes in the angle of the reflected light correspond to the underlying biomolecule binding events that are taking place at the surface layer, between the immobilized target and the flow of solution containing the ligand of interest.
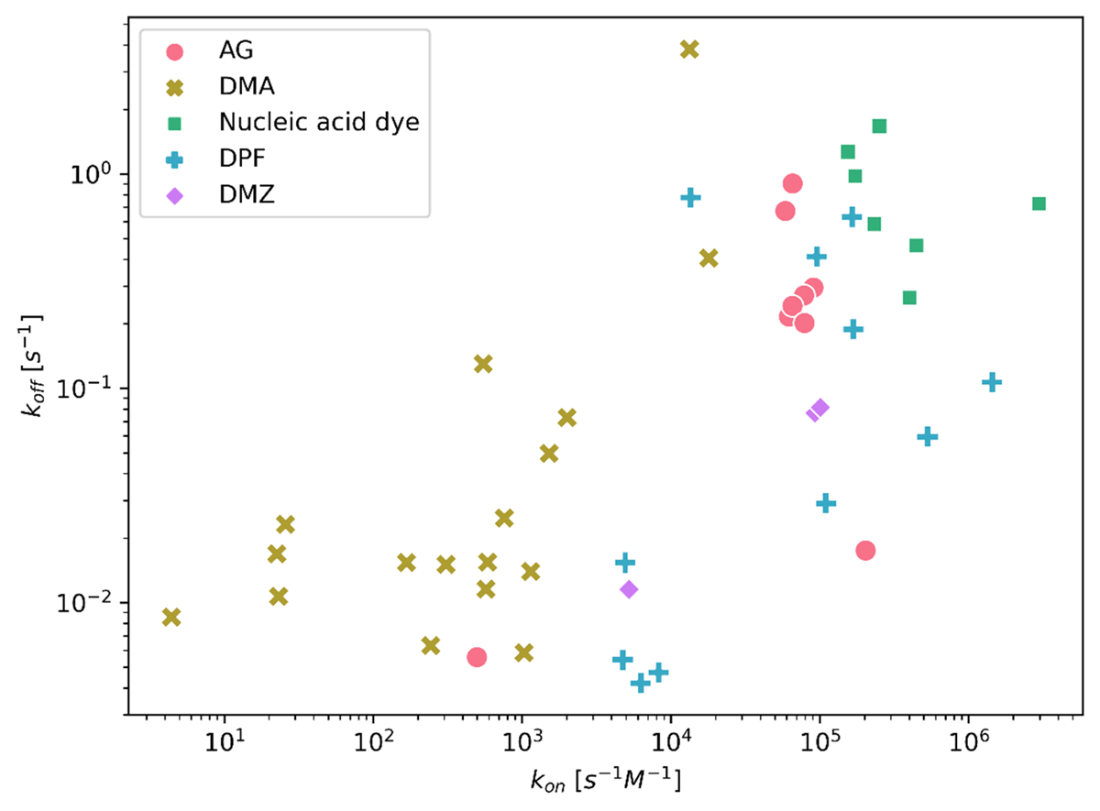
Mapping each ligand to its kon and koff coordinates.
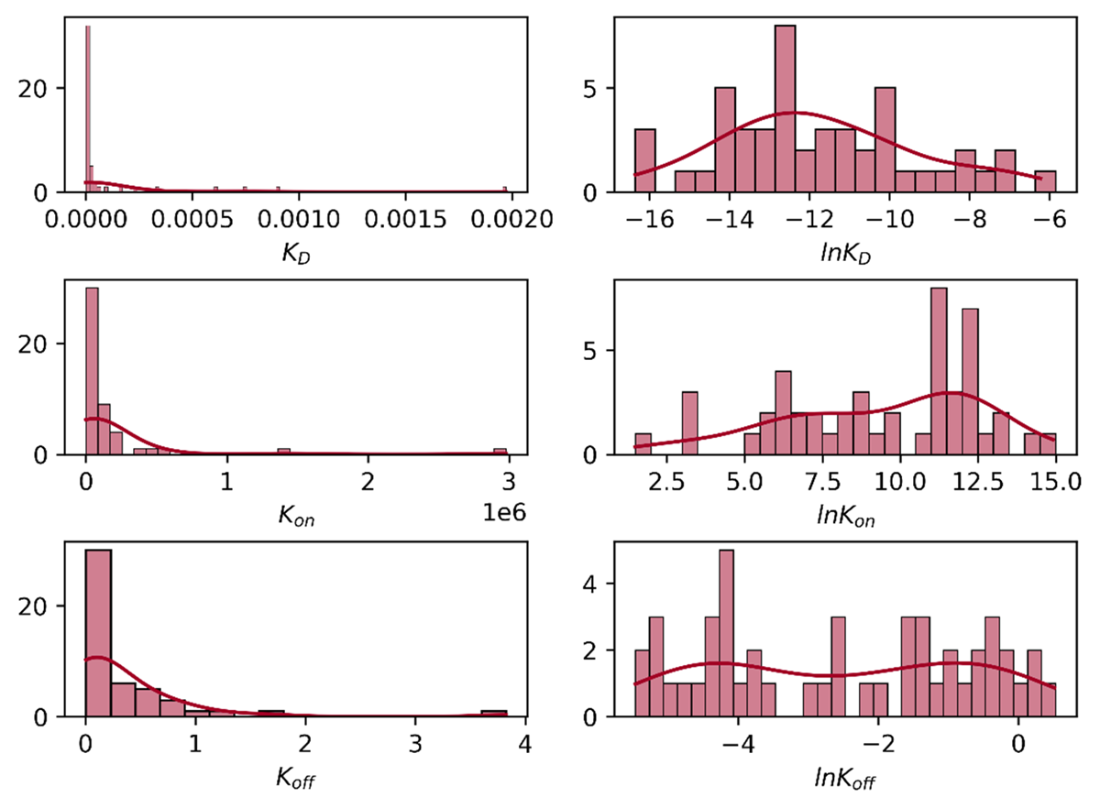
Comparison of the distributions for the raw target values to their log-transformed target values.
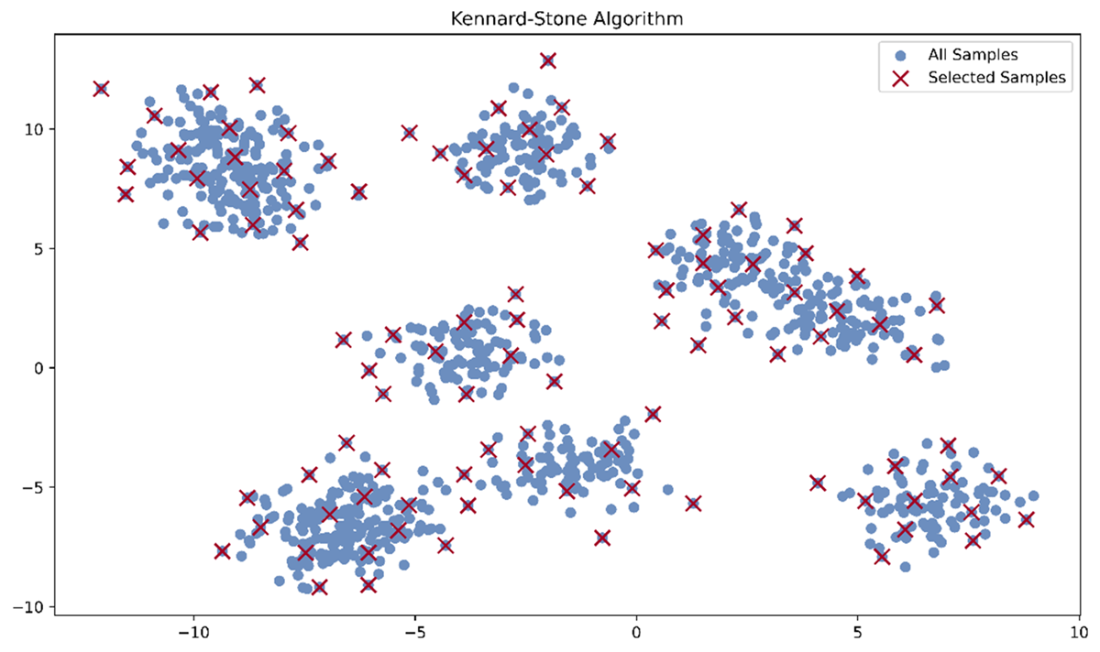
KSA ensures representative sampling from each cluster in this arbitrarily created data set, rather than sampling that is biased towards only one or two clusters.
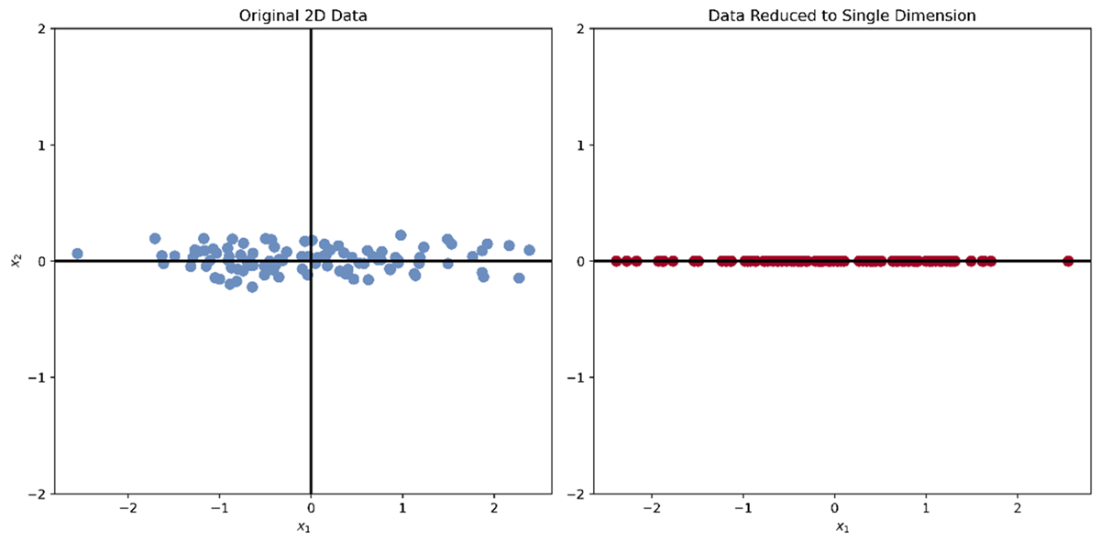
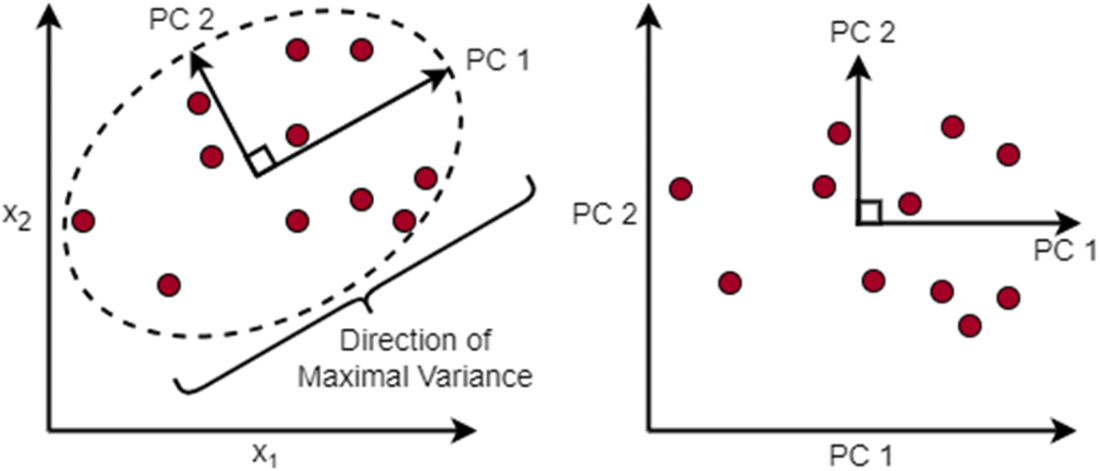
Dimension x2 carries almost no information since the x2-values for each point barely deviate relative to the values along dimension x1. Conversely, the x1 dimension carries a lot of information and removing it would result in a compressed form of the data that is very dissimilar from the original data.
PCA defines a new coordinate system based on principal components, where the important dimensions are self-evident, and we can reduce the data dimensionality to k by retaining the first k PCs as ranked by the amount of variance they explain.
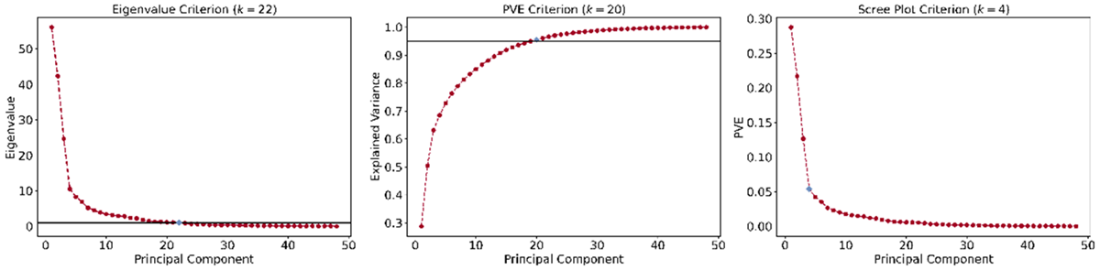
Optimal number of components to retain, k, for three different criteria. The blue diamond markers where the optimal k would be chosen for each plot. Note that the scree plot criterion is more subjective and values of k between 4 and 9, inclusive, could be argued for and selected.
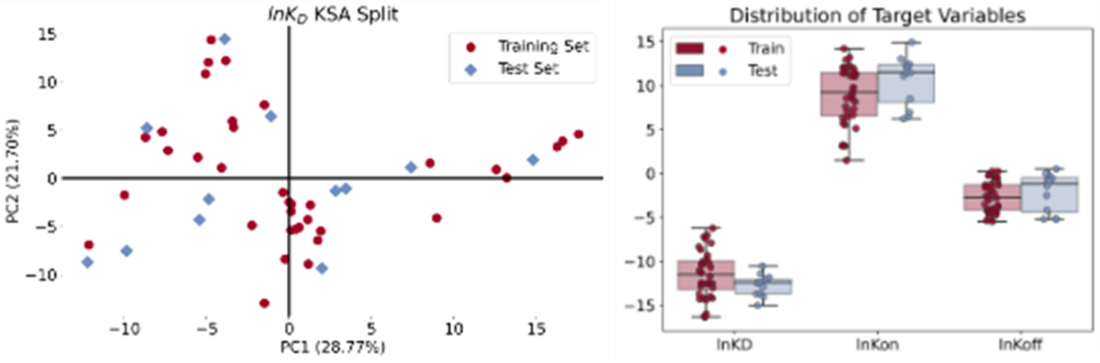
(Left) The train and test set molecules distributed in 2D chemical space. (Right) Distribution of the target variables after representative data splitting.
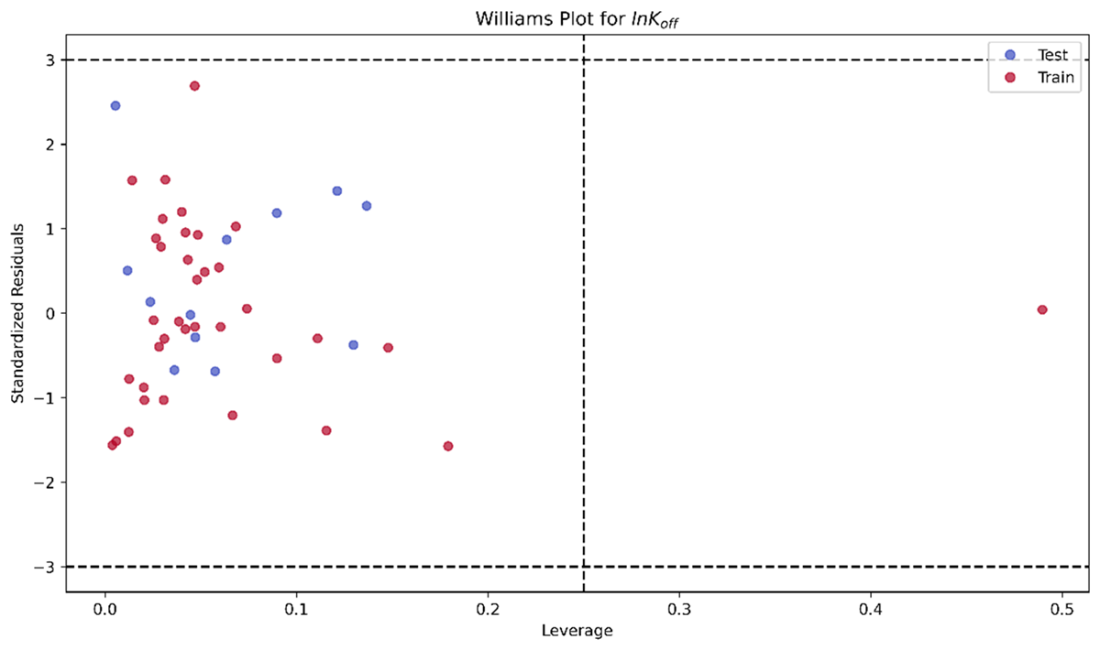
Williams plot for applicability domain assessment of lnKoff. Bounds are defined as a standardized residual greater or less than +3 or -3, respectively, or a leverage that is greater than 3(p + 1)/n, where p is the number of descriptors in the QSAR model and n is the number of data points.
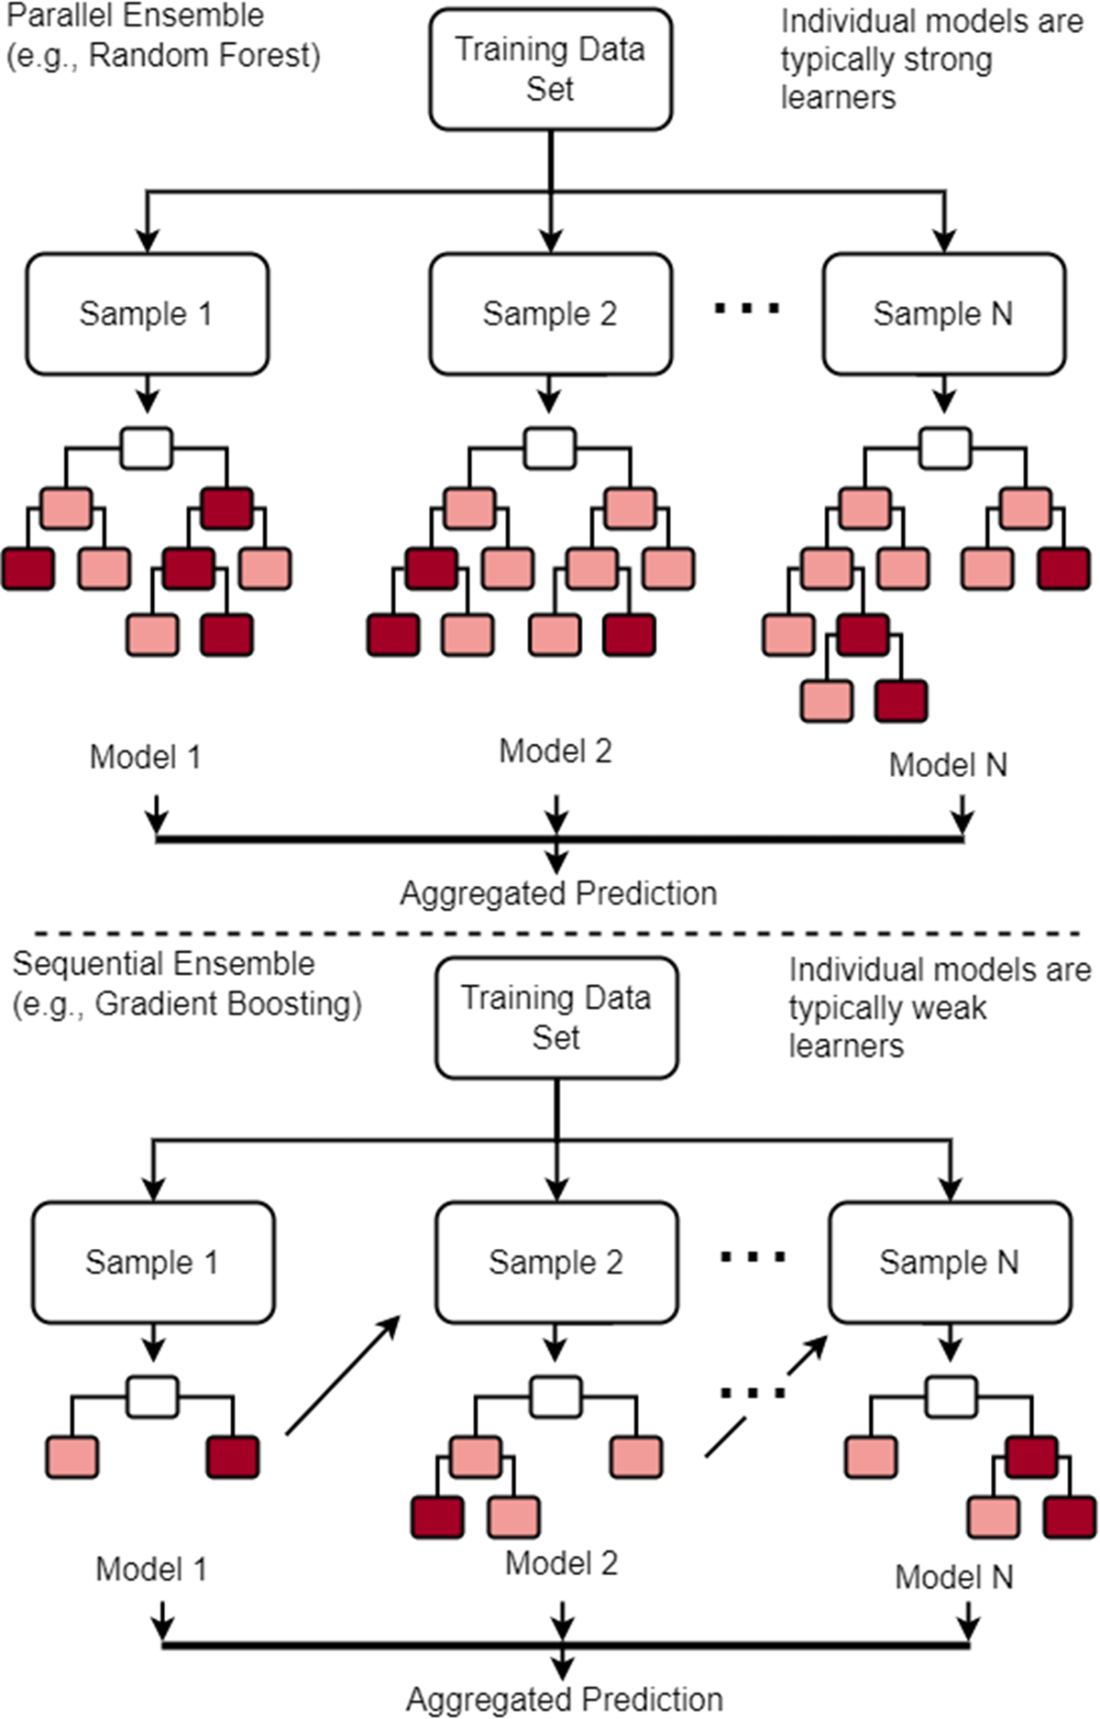
Parallel ensembles train multiple independent models and average their predictions to reduce variance, while sequential ensembles like boosting train a sequence of models where each new model corrects errors made by the previous models, reducing bias.
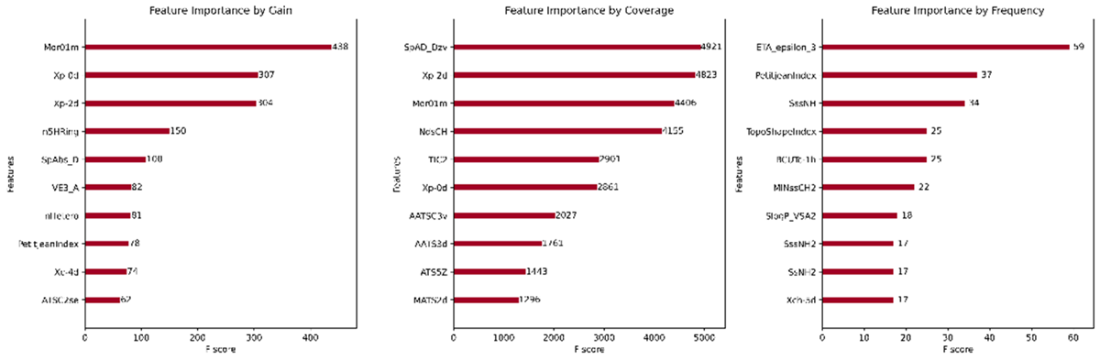
Feature importance of our XGBoost model across gain, coverage, and frequency metrics.
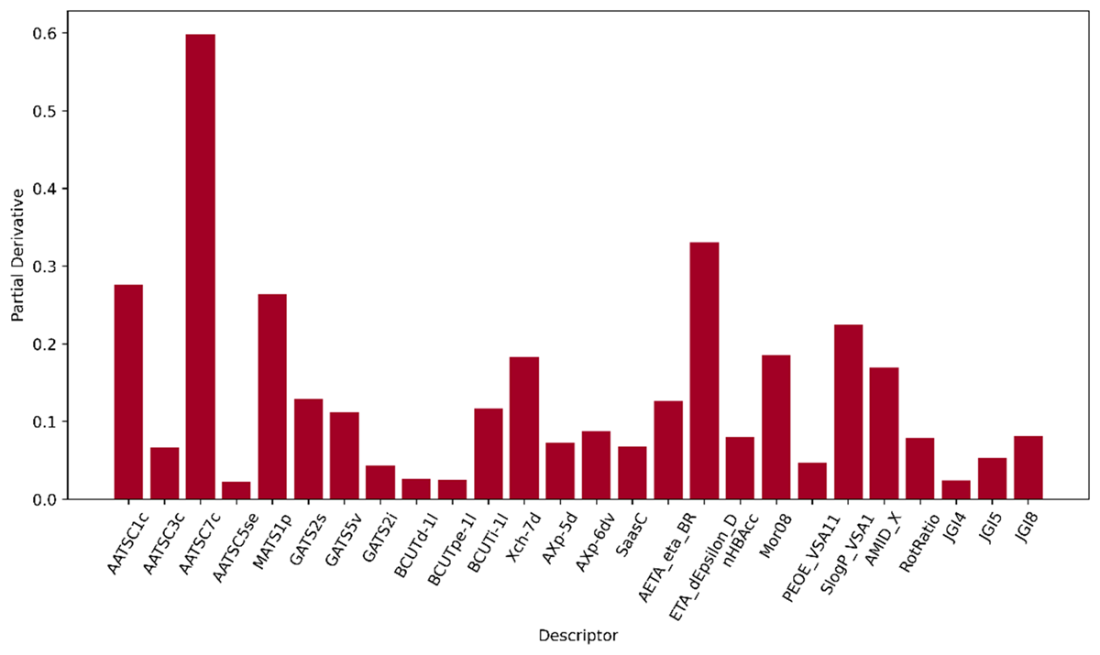
Descriptors with partial derivatives greater than 0.01 for the first RNA binder from the ROBIN data set.
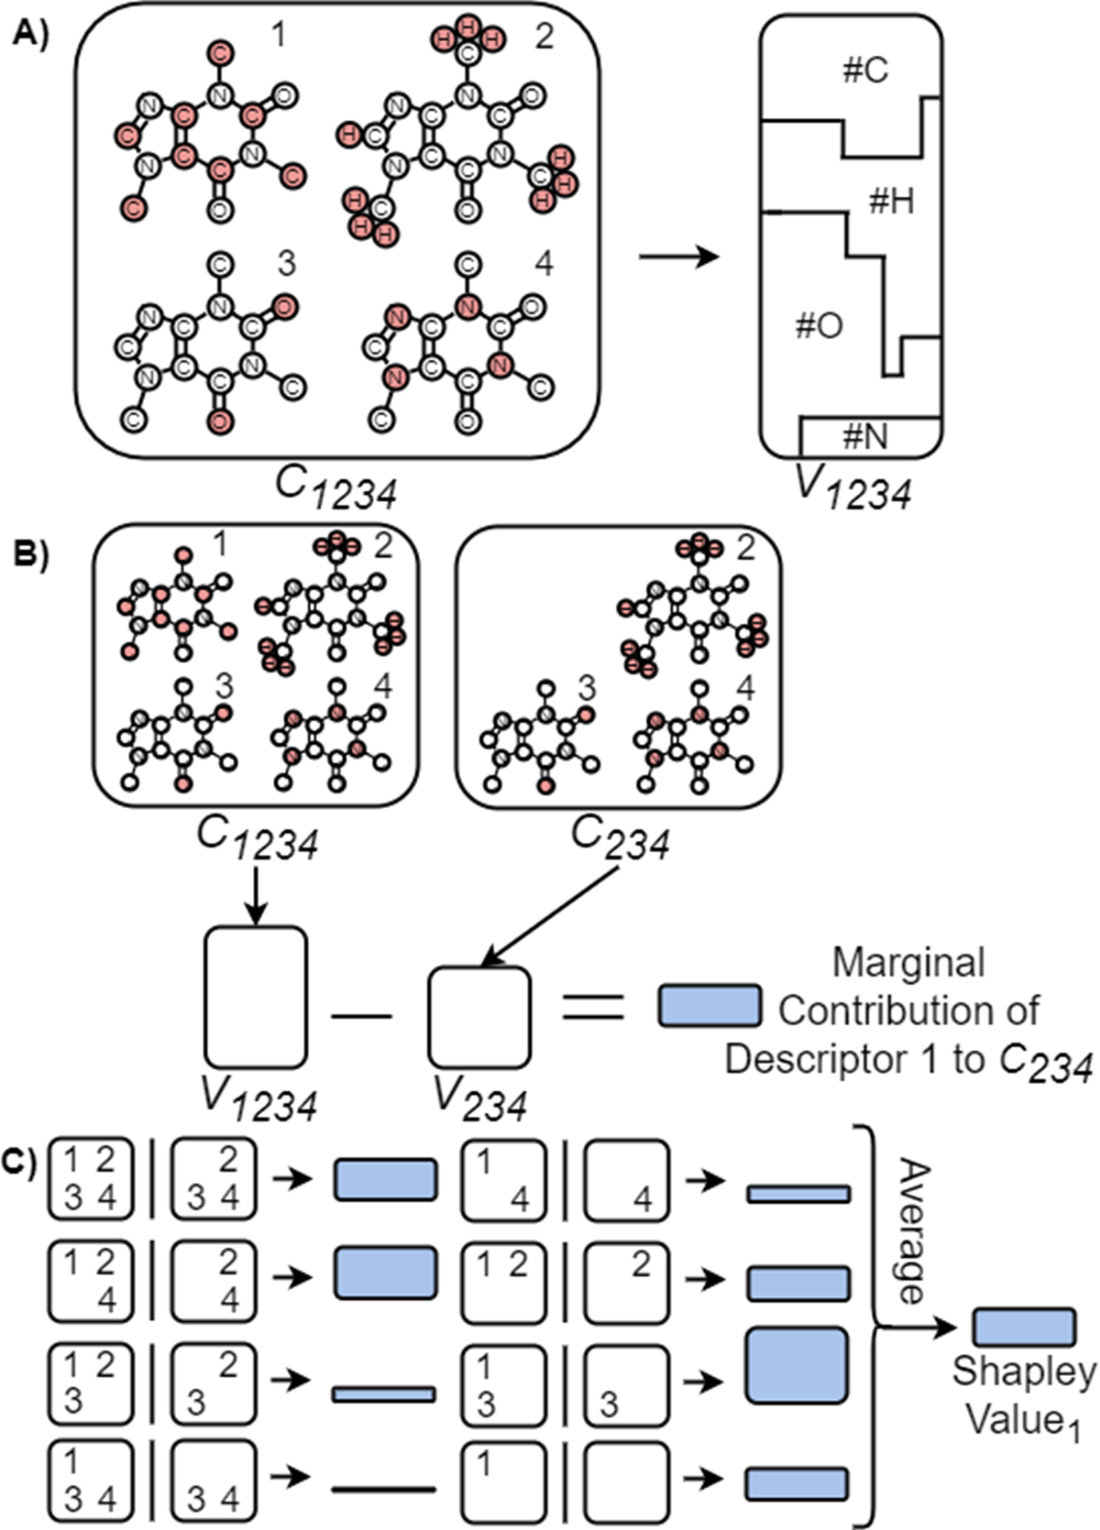
(A) Shapley value computation revolves around a coalition of descriptors and the model output, or value, that results from using those descriptors. (B) We want to understand each descriptor’s contribution to the coalition. We can take the difference between a coalition containing a given descriptor and the same coalition without that descriptor, resulting in the marginal contribution of the descriptor to the coalition. (C)
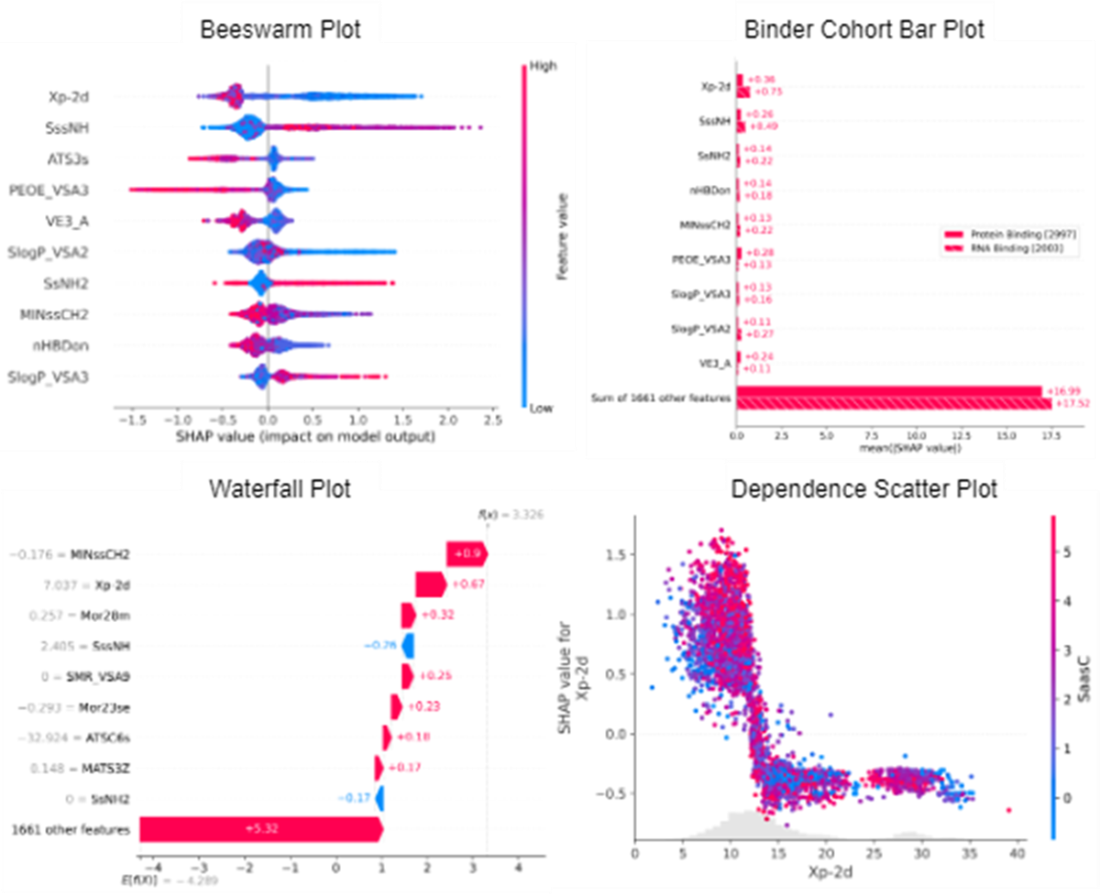
SHAP visualizations to support global interpretation of descriptor importance (beeswarm plot), comparison of binder cohorts across important descriptors (bar plot), local interpretation of descriptor importance for a single compound (waterfall plot), and the effect of a single descriptor on model predictions (scatter plot).
Summary
- RNA is a versatile molecule that plays key regulatory roles in cells and its use as a small molecule target presents promise in novel therapeutic development. For example, small molecules that modulate RNA structures involved in cancer progression have been investigated as potential anticancer agents. High resolution RNA:small-molecule structures are difficult to characterize, increasing difficulty in studying small molecule binding to a specific RNA target and, consequently, rational design of small molecule drug candidates optimized to bind to the target. Carefully constructed QSAR models are critical to interpreting which properties of a chemical compound relate to optimal binding to an RNA target.
- With limited data, it paid to spend more time on comprehensive descriptor calculation that accounts for two dimensions along which each ligand can be searched across: its protomer space and its conformer space.
- The Kennard-Stone algorithm (KSA) is useful to split data, selecting a representative subset of training samples from the full dataset in a way that maximizes the diversity of the selected training subset. It is particularly helpful in identifying representative samples that capture the variability of the entire dataset and ensuring alignment between the train and test set distributions while broadening our QSAR model’s applicability domain across the training set’s diverse features and response space.
- Several problems occur because of the curse of dimensionality, which is the notion that statistical tasks become exponentially more difficult as the dimensionality of the data increases. To contend, we take advantage of the blessing of non-uniformity: not all dimensions are equally important in describing real world data. By focusing on the most relevant dimensions, we may reduce the data set’s dimensionality without removing dimensions that comprise important information. Principal components analysis (PCA) is one method to compress our data set into a smaller number of linear features that still adequately summarize the original data.
- Boosting develops sequential ensembles by iteratively aggregating models so that each successive model compensates for the errors from the previous model. Boosting combines weak learners that are easy and efficient to train and may generalize better and, by sequentially training each weak learner to correct the errors of the previous learner, the ensemble’s aggregated predictions perform better on difficult instances, minimizing bias while retaining the low variance of the individual models.
- Model-agnostic interpretability is advantageous because we can compare models across consistent metrics of feature importance. They are also flexible to any machine learning method, so we don’t need to restrict ourselves to underperforming methods. Model-agnostic interpretation can be done by examining how perturbations in the data affect model output (e.g., partial derivative and sensitivity analysis) or by constructing a surrogate model that is intrinsically transparent (e.g., SHAP).

 Build AI Drug Discovery Pipelines ebook for free
