5 Classification: Cytochrome P450 Inhibition
Metabolism is a central concern in drug discovery because many drugs are cleared by the body through enzymatic breakdown, and inhibition of these enzymes can strongly alter drug exposure, efficacy, and safety. The chapter focuses on cytochrome P450 inhibition, especially CYP3A4, as a practical classification task for high-throughput screening. Using molecular fingerprints and a curated inhibition data set, it frames the problem as predicting whether a compound should be filtered out as a likely inhibitor, with an emphasis on the importance of calibration, thresholding, and uncertainty in decision-making.
The chapter begins with logistic regression as a foundational binary classifier, explaining how the sigmoid function turns linear scores into probabilities and how binary cross-entropy guides training. It then moves beyond raw accuracy to metrics better suited to imbalanced data, such as precision, recall, PR AUC, and ROC AUC, while also showing how to select operating thresholds and interpret model outputs through log-odds and odds ratios. To make probabilistic predictions more trustworthy, it introduces calibration diagnostics like reliability plots and summary measures such as RMSCE, ECE, MCE, and Brier score, along with post-hoc fixes like Platt scaling and isotonic regression.
To improve performance and flexibility, the chapter next covers decision trees and then ensemble methods, especially random forests, which reduce variance through bagging and feature subsampling. It discusses how to address class imbalance through sampling, class weighting, and augmentation, and shows how to interpret models using feature importance and similarity maps. Finally, it expands the problem to multiclass and multilabel settings for multiple CYP targets, using appropriate metrics for ranking and coverage, and closes by emphasizing applicability-domain checks so predictions are only trusted when the model has enough support from the input space.
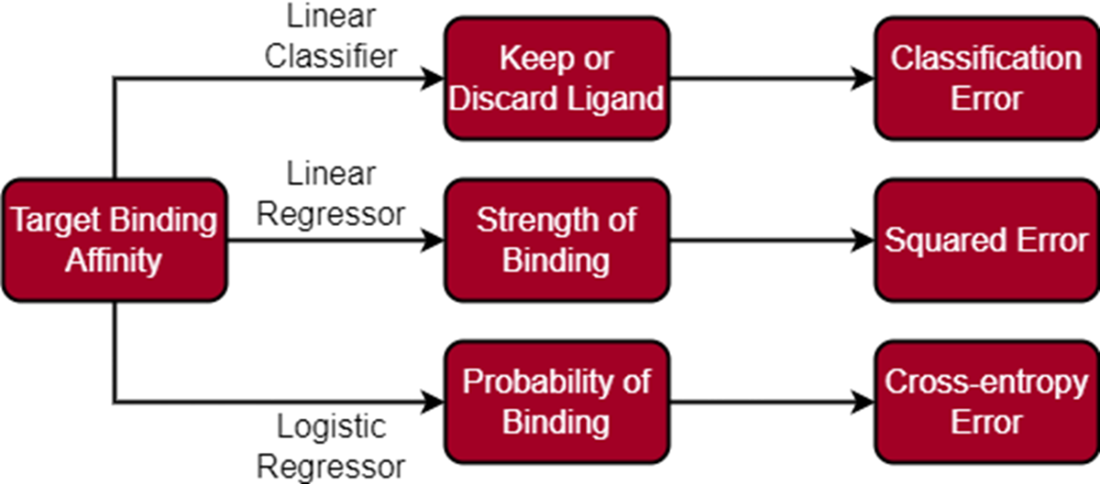
Comparing the difference in use cases between linear classifiers, linear regressors, and logistic regressors.
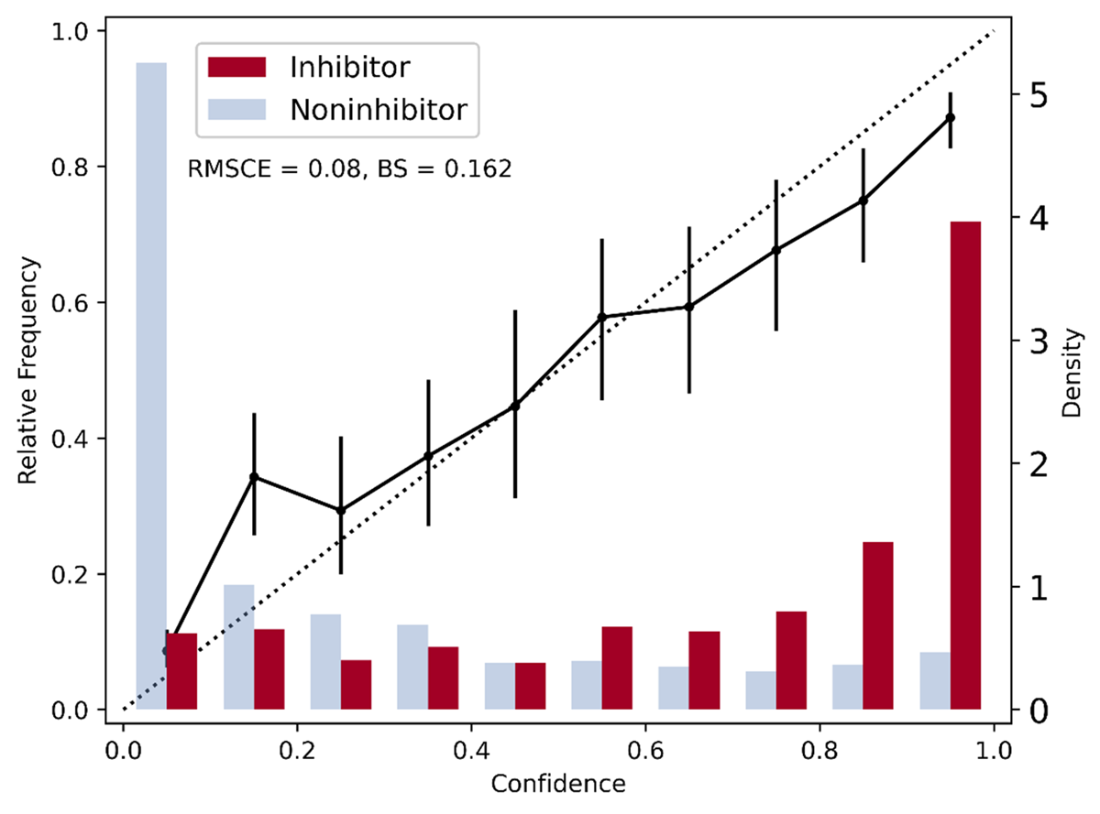
Reliability diagram with error bars for logistic regressor trained on CYP 3A4 data set. Probability estimates, RMSCE, and BS derived from predictions on validation set.
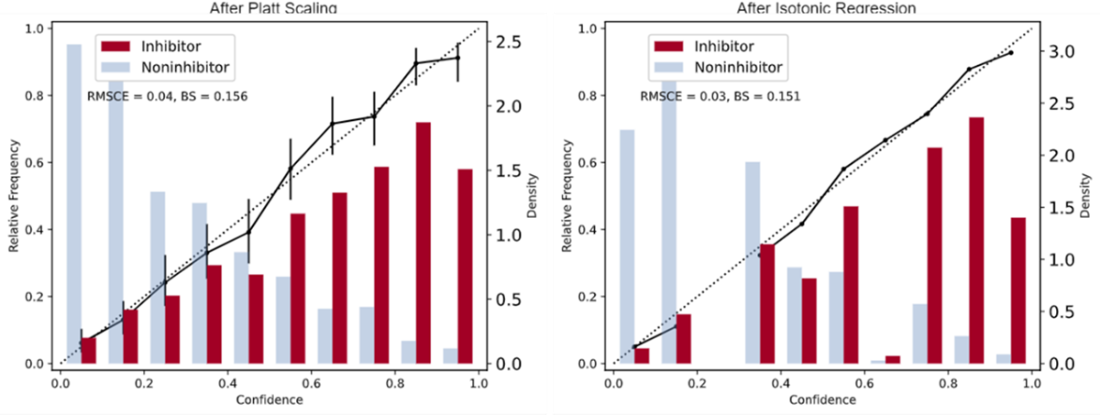
Reliability diagram for the logistic regressor after undergoing calibration via platt scaling or isotonic regression.
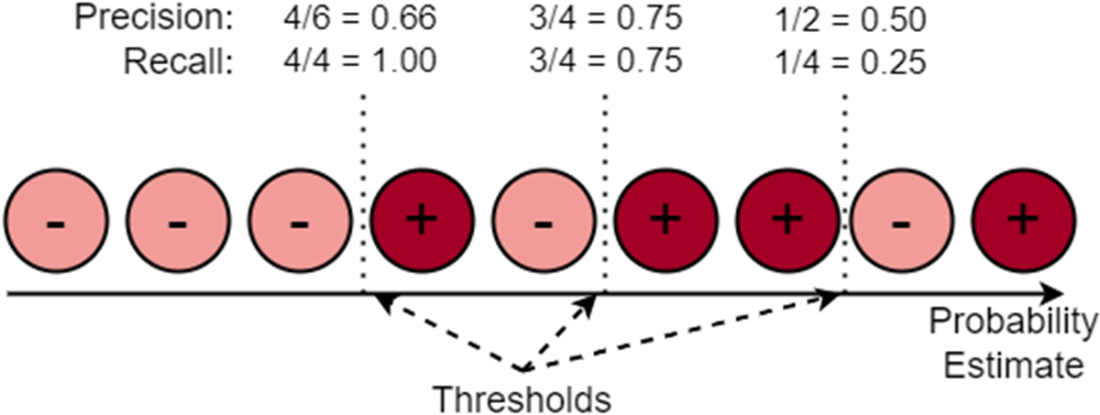
Decreasing the decision threshold will capture more true positives, but could also result in more false positives.
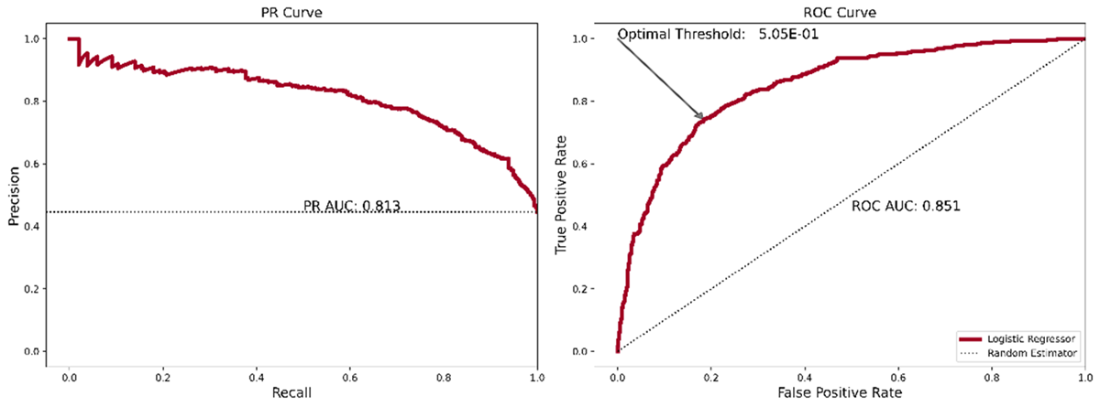
PR and ROC curves for the logistic regressor and the random baseline.
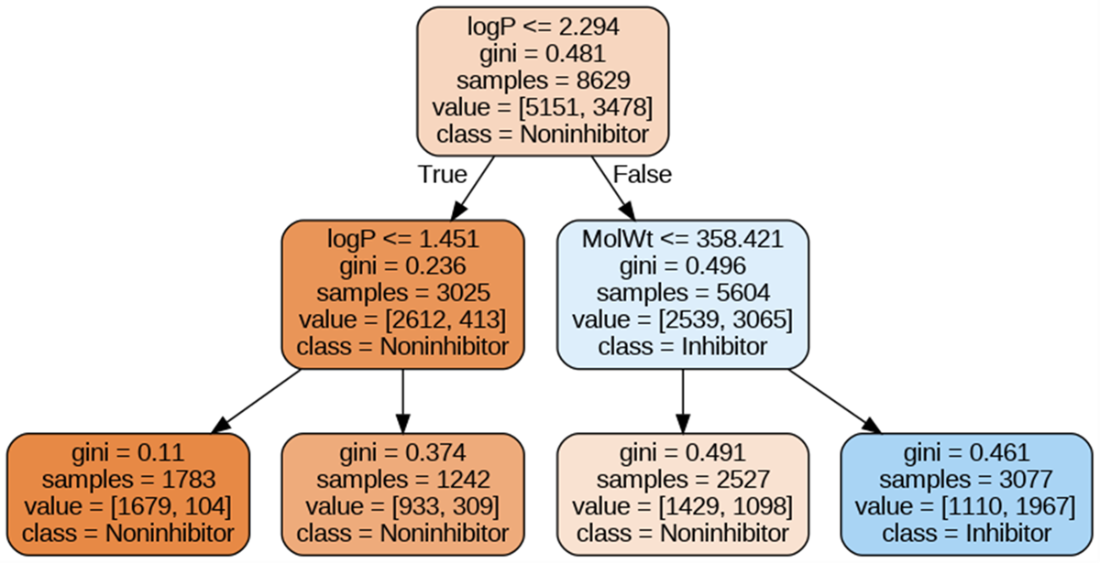
Visualizing a depth 2 decision tree constructed with consideration of molecular weight and logP.
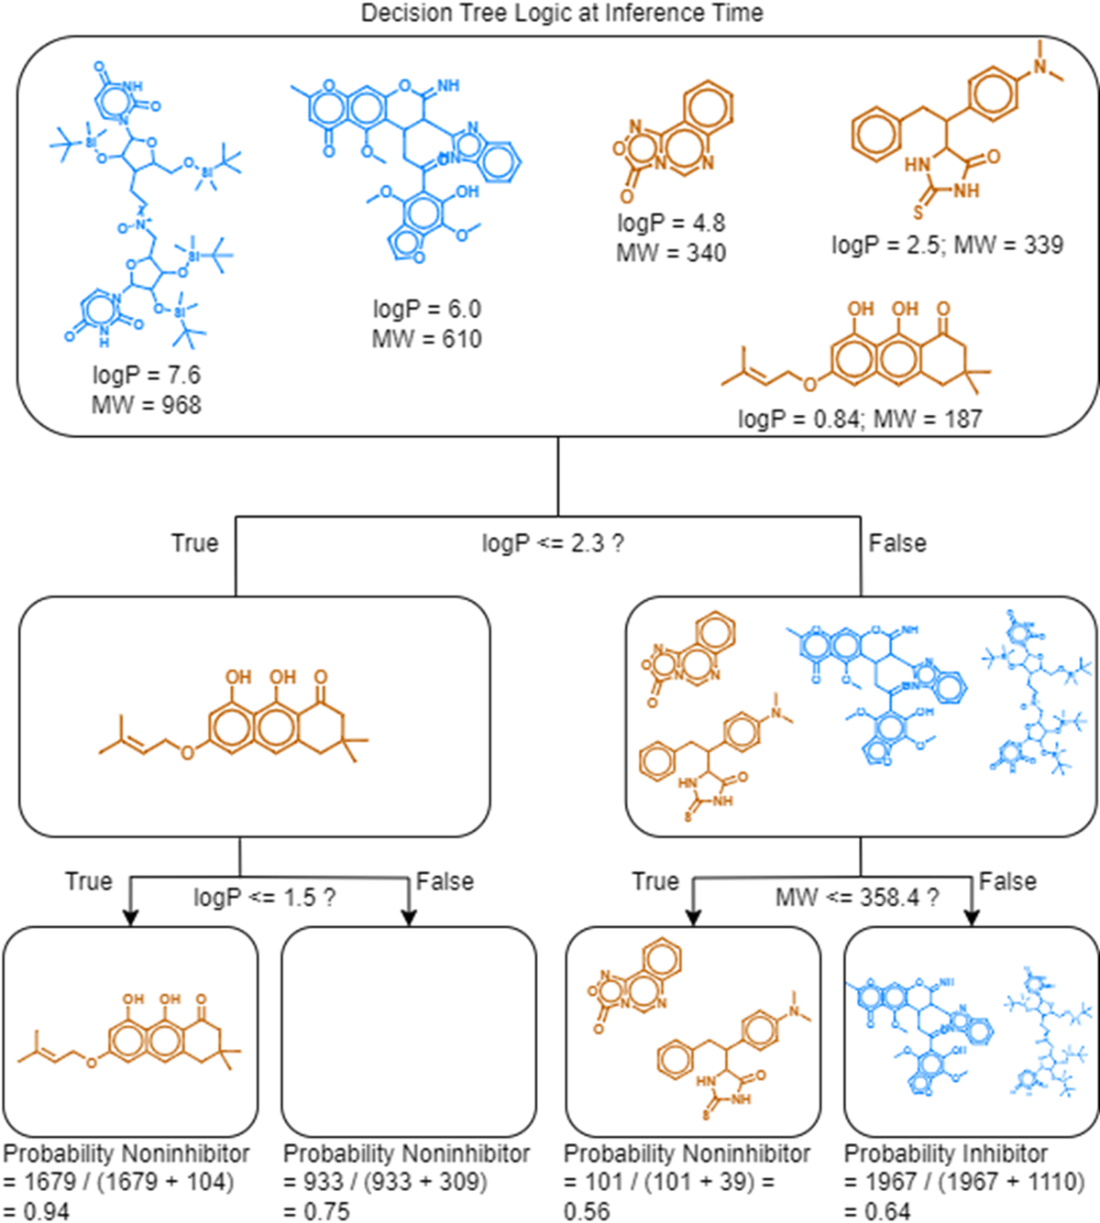
Example of how 5 of the validation set molecules would traverse the decision tree from figure 5.6 during inference time.
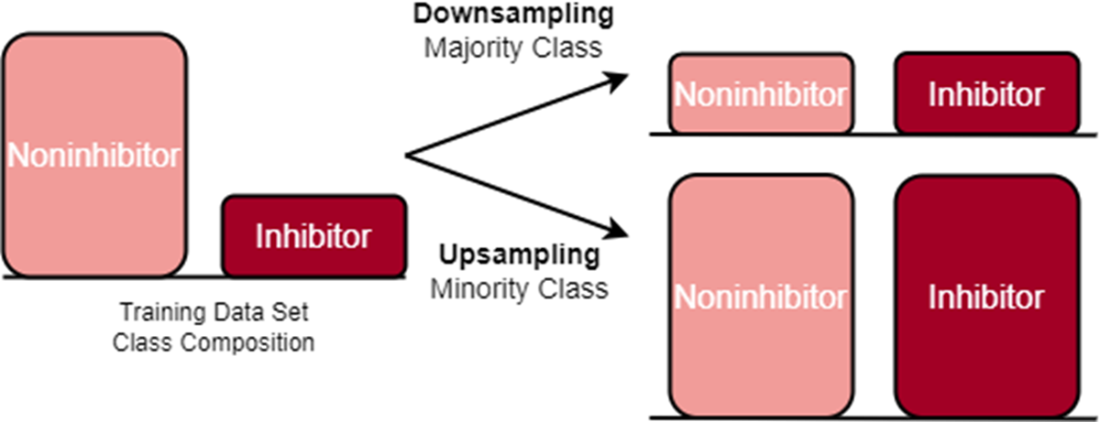
Comparison of downsampling and upsampling on the training data set’s class composition.
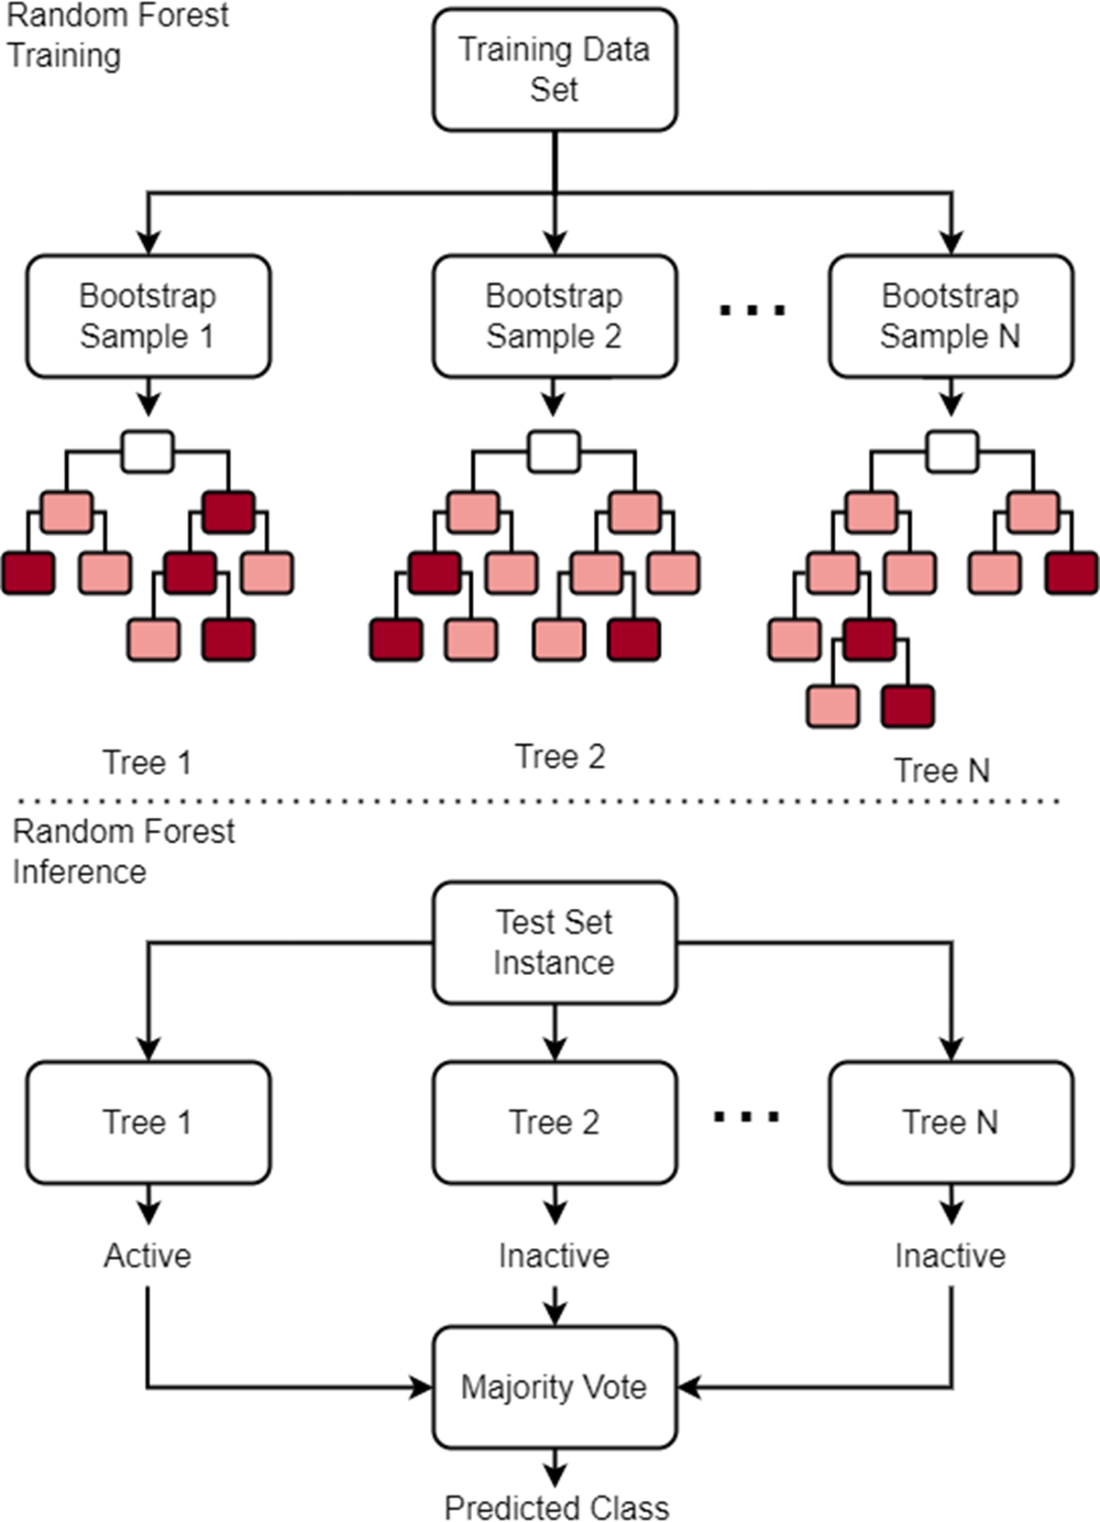
How a Random Forest is constructed via a decision tree ensemble and applied at inference time.
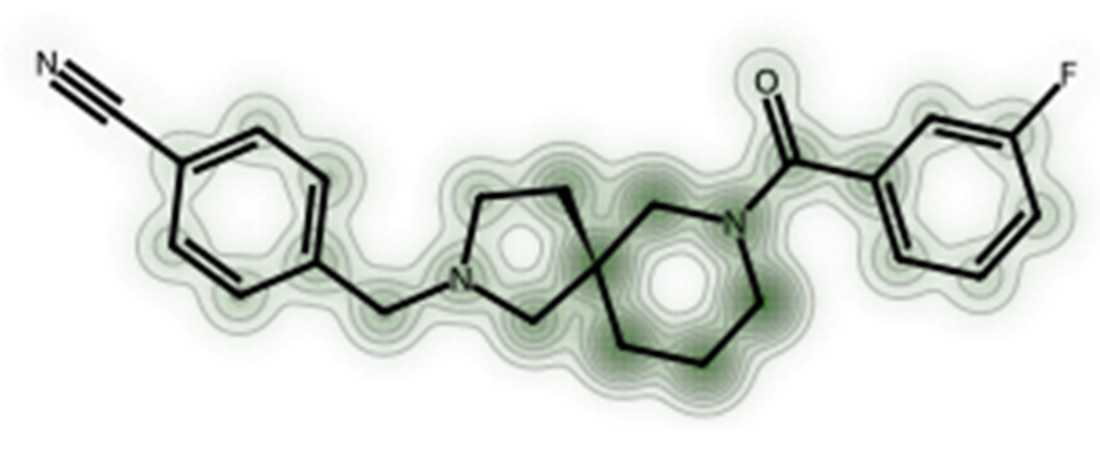
Example of a similarity map with a validation set molecule and our Random Forest classifier.
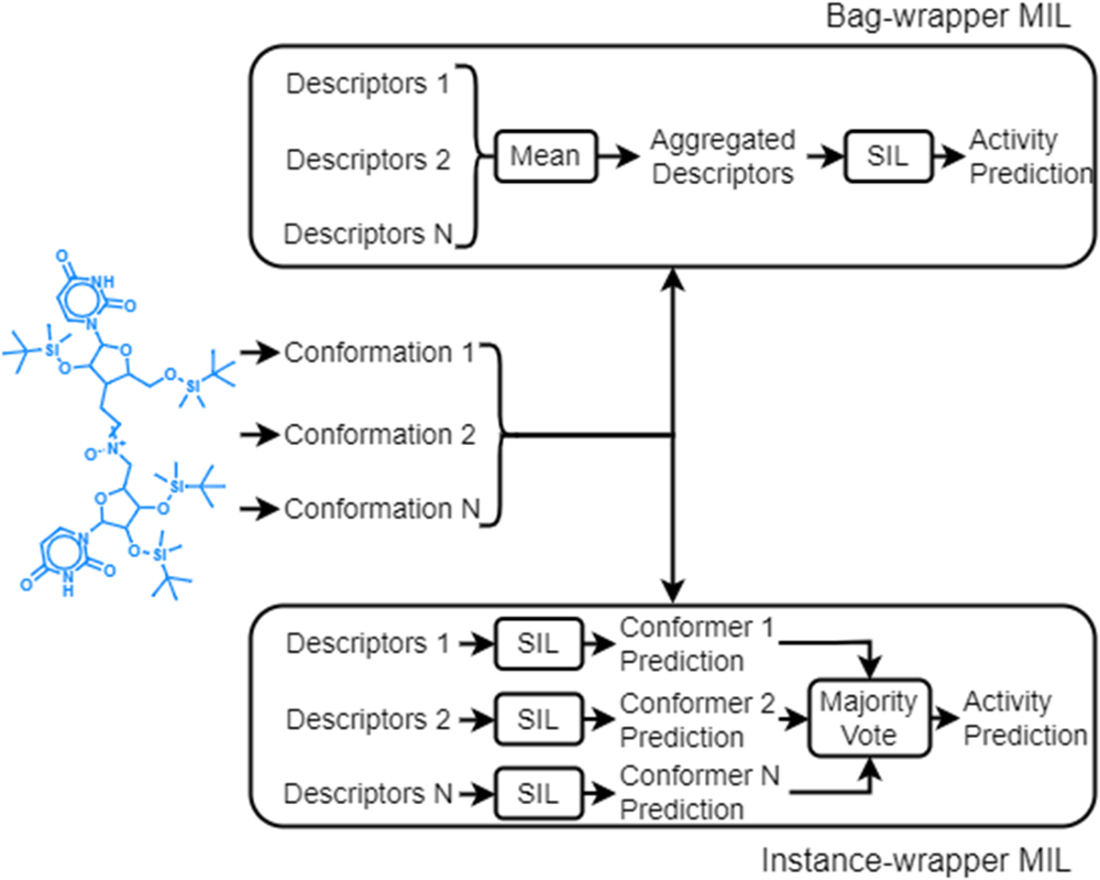
Comparison of bag-wrapper and instance-wrapper variants of multiple-instance learning.
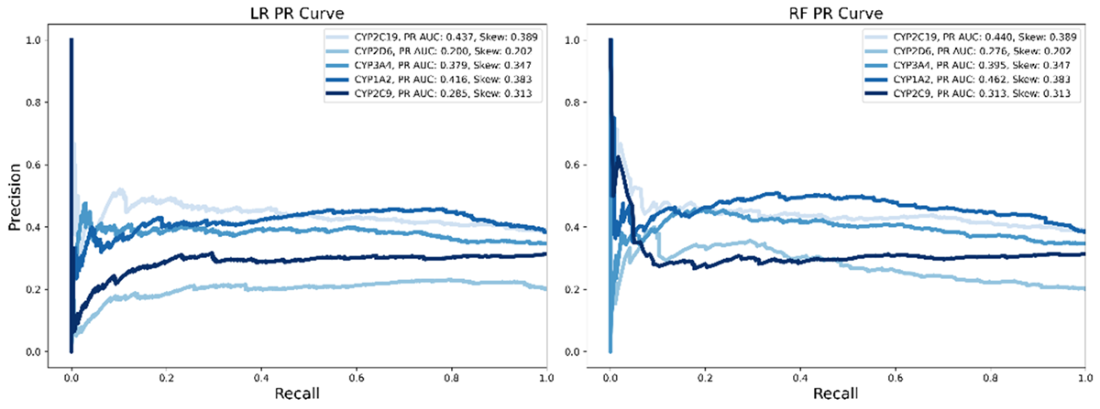
PR curves and AUC performance on our custom multilabel classification task.
Summary
- In drug discovery, metabolism refers to the body’s ability to break down foreign molecules called xenobiotics, which includes drugs. Drugs are metabolized so that the molecules and their effects may be eliminated from the body. The duration and intensity of a drug’s action are dependent on how the drug is metabolized.
- The Cytochrome P450 (CYP) superfamily of 57 enzymes aids in the elimination of over 40% of drugs and CYPs 1A2, 2C9, 2C19, 2D6, 3A4 account for almost 90% of CYP-mediated metabolism. Inhibition, or blockage, of a CYP or another metabolic enzyme could significantly shift the pharmaceutical effect of other drugs or chemicals in the body, resulting in a drug-drug interaction (DDI).
- Logistic regression helps us make predictions for binary outcomes by transforming inputs into a range of values from 0 to 1, inclusive. Logistic regression is typically used for classification by defining a decision boundary or threshold to binarize its probability estimates into class predictions. We can assess model performance over a range of possible decision thresholds via precision-recall (PR) and receiver operating characteristic (ROC) curves.
- Calibrated models build trust in their predictions and increase transparency for users, leading to increased acceptance and adoption. We can diagnose miscalibration with reliability diagrams, root mean squared calibration error, and Brier score. We can correct miscalibration with post-training calibration methods such as platt scaling and isotonic regression or by computing an optimal decision threshold with Youden’s index.
- Decision trees are like flowcharts – breaking down a complex problem into a series of simpler decisions. Imagine that the model is playing a guessing game, asking questions to help it narrow down the possibilities until it arrives at an answer. Each node in a decision tree represents a decision based on a specific feature. Starting from the root node, the tree branches out, with each branch representing a decision. The goal of the decision process is to reach a leaf node in the tree, which will provide the final prediction.
- Random Forest ensembles sample different subsets of data to train multiple decision trees, introducing an extra layer of randomness by considering only a random subset of features at each split in the tree-building process. This feature subsampling helps decorrelate the trees, making the ensemble even more diverse. Random Forests greatly reduce decision tree variance while holding on to their ability to achieve low bias.
- Binary classification only models two possible classes. Multiclass classification is a type of ML task where the algorithm’s goal is to learn to categorize data points into more than two distinct classes or categories. Each class represents a different possible outcome, and the model is trained to make predictions that assign a new input to one of these classes. In contrast, multilabel classification predicts a set of labels for each instance and is applicable when an instance can simultaneously belong to multiple classes. Multilabel performance can be summarized with ranking metrics such as coverage error and ranking loss and, when aggregating per-class metrics like F1, with micro- or macro-averaging depending on whether frequent or rare labels should dominate.

 Build AI Drug Discovery Pipelines ebook for free
