11 Monitoring and analytics: Measuring API product metrics
Monitoring and analytics in API delivery are presented as continuous feedback mechanisms that help teams improve both product outcomes and technical reliability. The chapter connects these practices to DevOps and APIOps by showing that metrics should not be collected for their own sake, but used to study what is happening in production, validate improvement ideas, and guide the next iteration of the product. Product analytics is framed as especially important because it reveals how the API is contributing to business goals, not just how the system is performing technically.
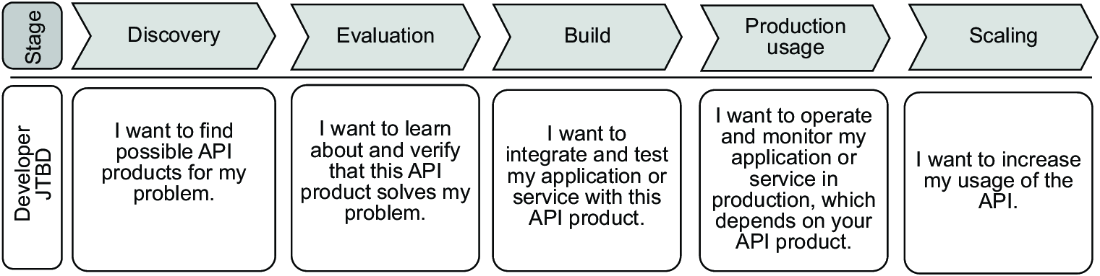
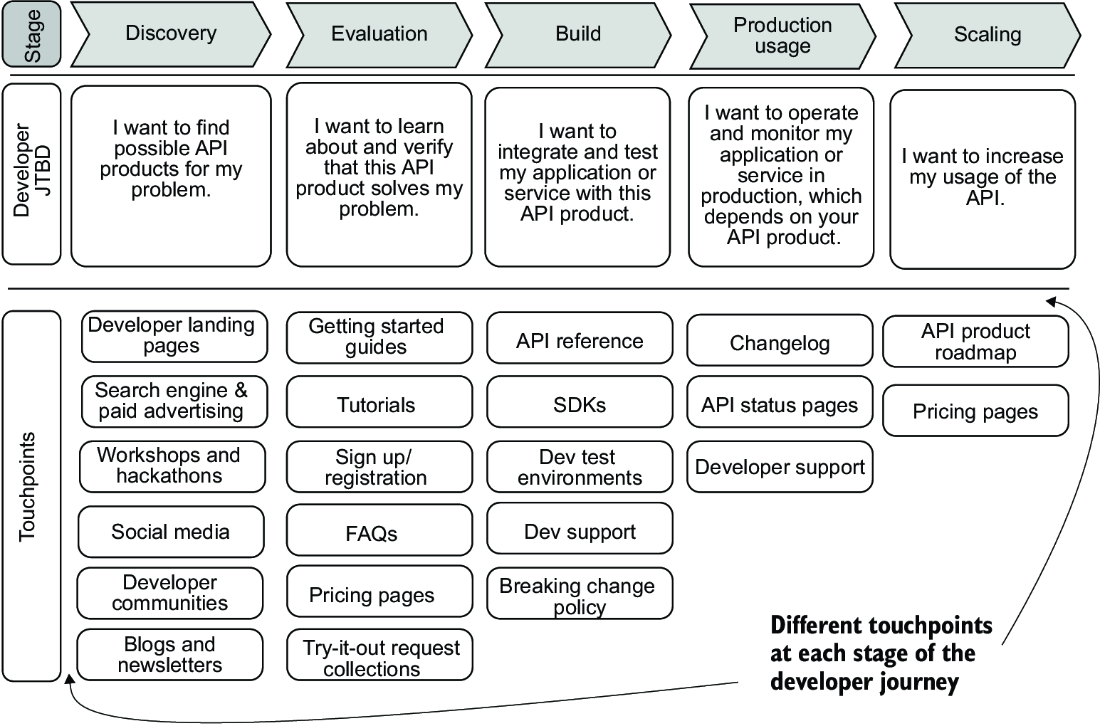
The chapter emphasizes that API product metrics should follow the developer journey, since developers are the primary users of an API product. A journey map helps teams identify meaningful touchpoints from discovery through evaluation, build, production usage, and scaling, and then attach metrics at the moments where developers experience value. The main metric categories discussed are discovery, engagement, acquisition, activation, retention, and experience, with examples such as visitors to the developer portal, time to first call, daily active users, time to first transaction, user retention, conversion rate, and top users by production usage. The overall message is to use a focused set of leading indicators that support a north-star business metric rather than trying to measure everything.
The chapter also distinguishes product analytics from API monitoring for technical health. Monitoring focuses on latency, traffic, error rates, saturation, and related infrastructure and service-level signals, with the RED method highlighted as a practical framework for microservices. It explains the importance of alerts, synthetic monitoring, rate limits, and service concepts such as SLIs, SLOs, and SLAs so teams can detect failures quickly and maintain a predictable user experience. Together, product analytics and operational monitoring give API teams the visibility they need to improve adoption, reduce friction, and keep the API healthy over time.
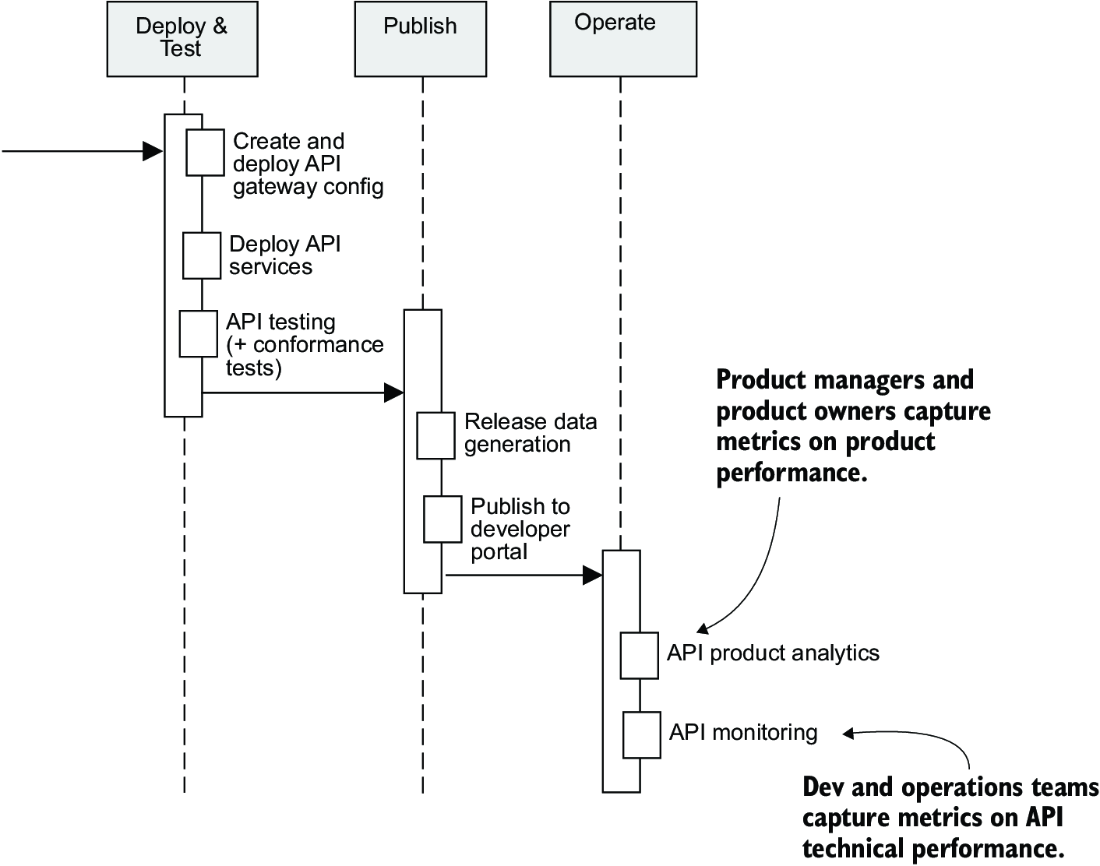
API monitoring and product analytics are in the operation stage of the API product delivery life cycle.
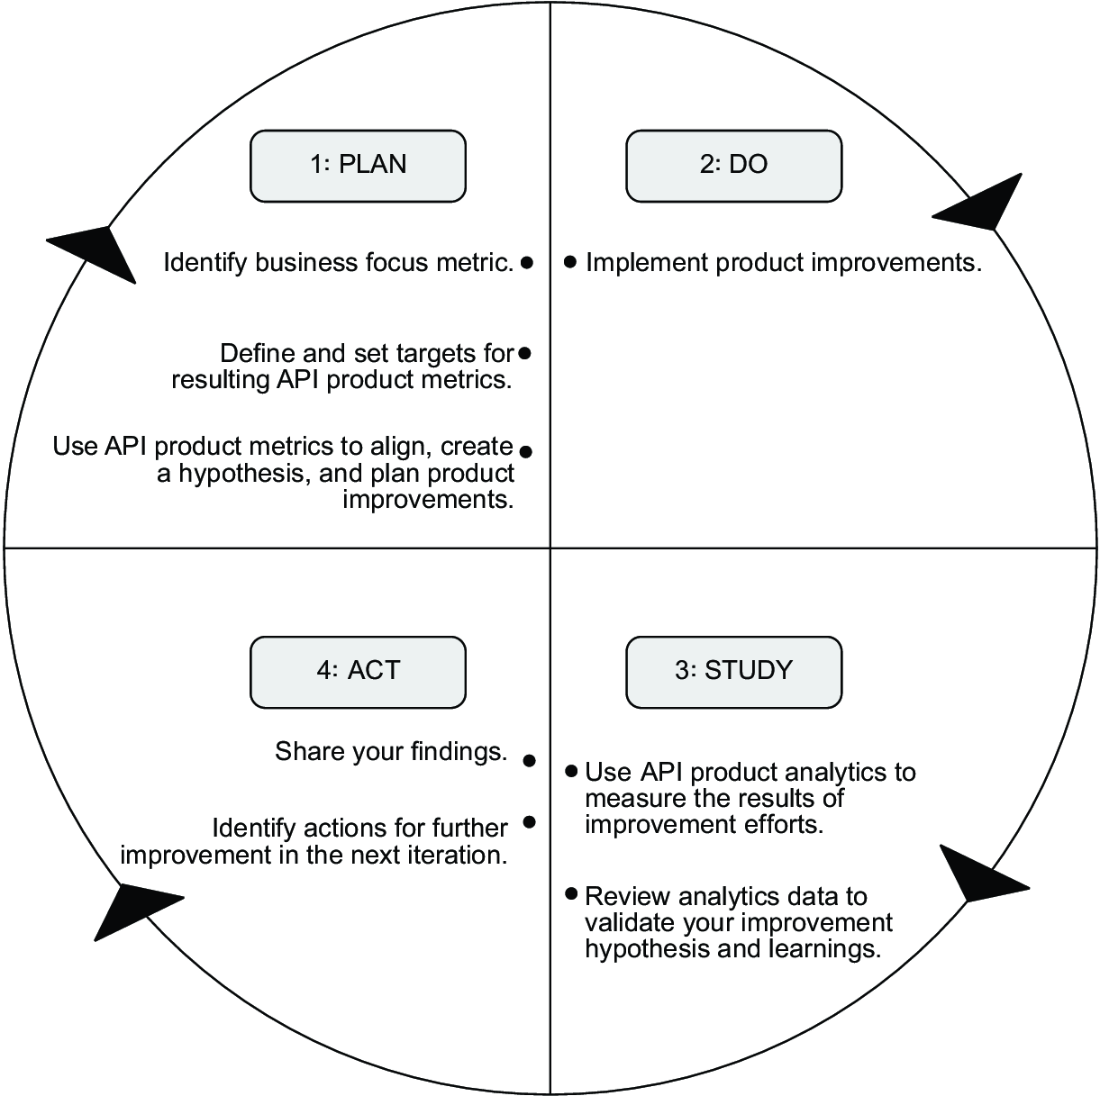
API product improvements as PDSA cycle
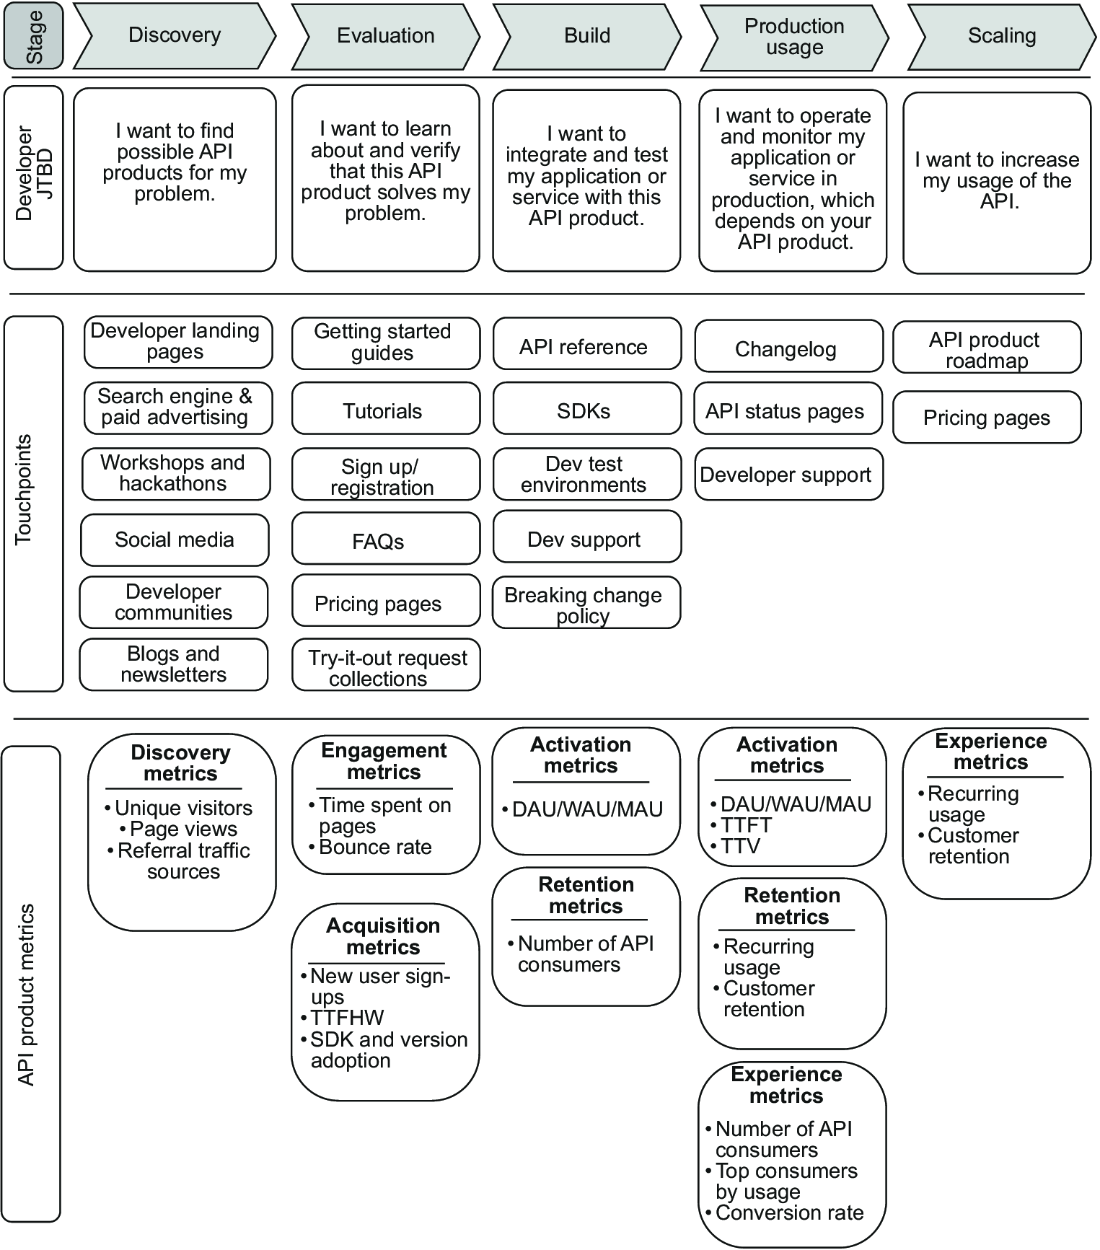
The beginning of a developer journey map, showing the job the developer seeks to fulfill at each stage
Extending the developer journey map with touchpoints
Extending the developer journey map with API product metric categories
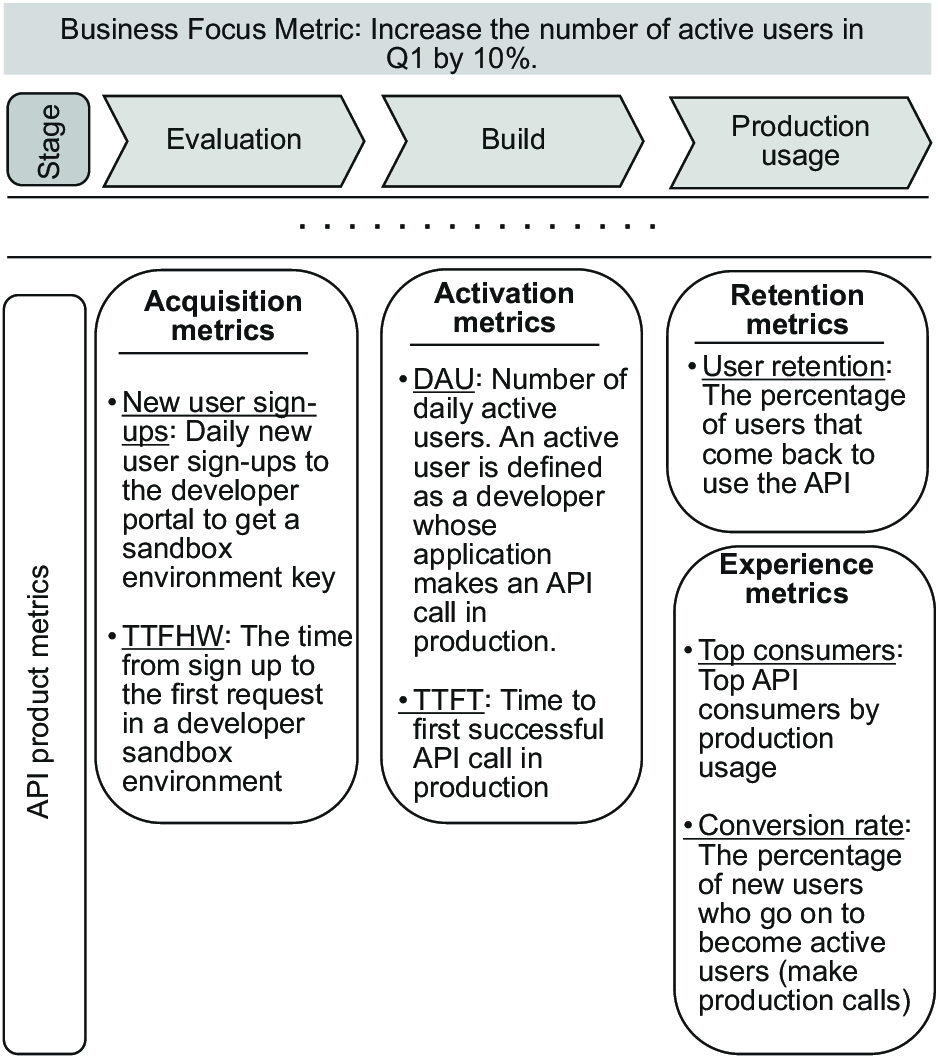
A section of the developer journey map showing how the API team has defined metrics they want to capture to drive improvements in the Product Catalog API
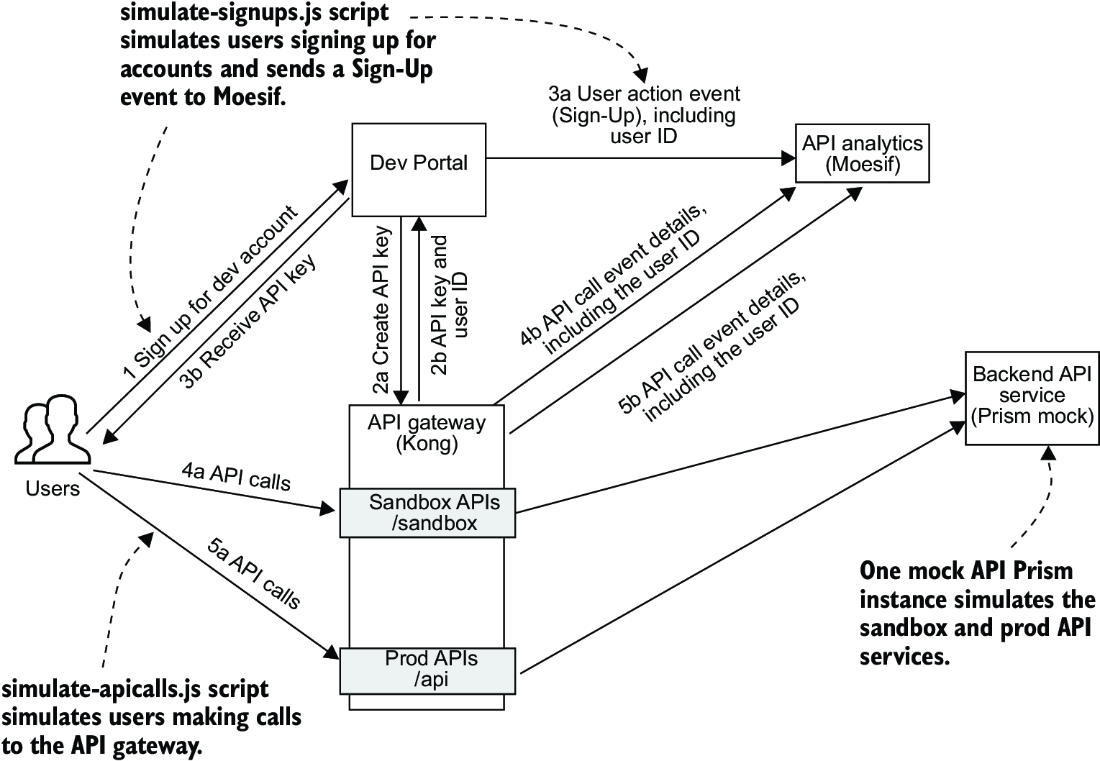
The workflow file simulates user sign-ups to a developer portal and API calls to the gateway. It sends the associated user action events and API call events to Moesif.
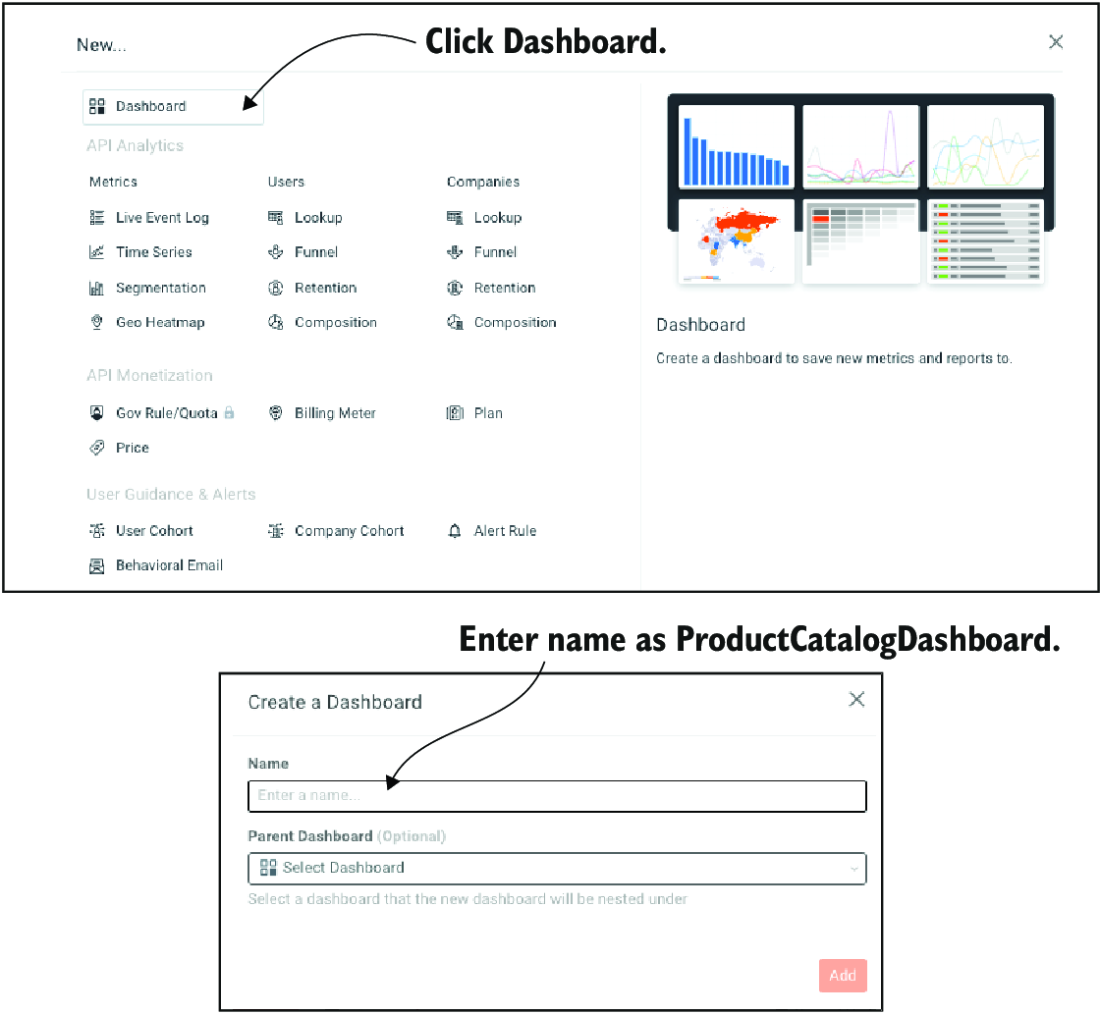
Creating a dashboard to save your analytics reports
Event stream to Moesif
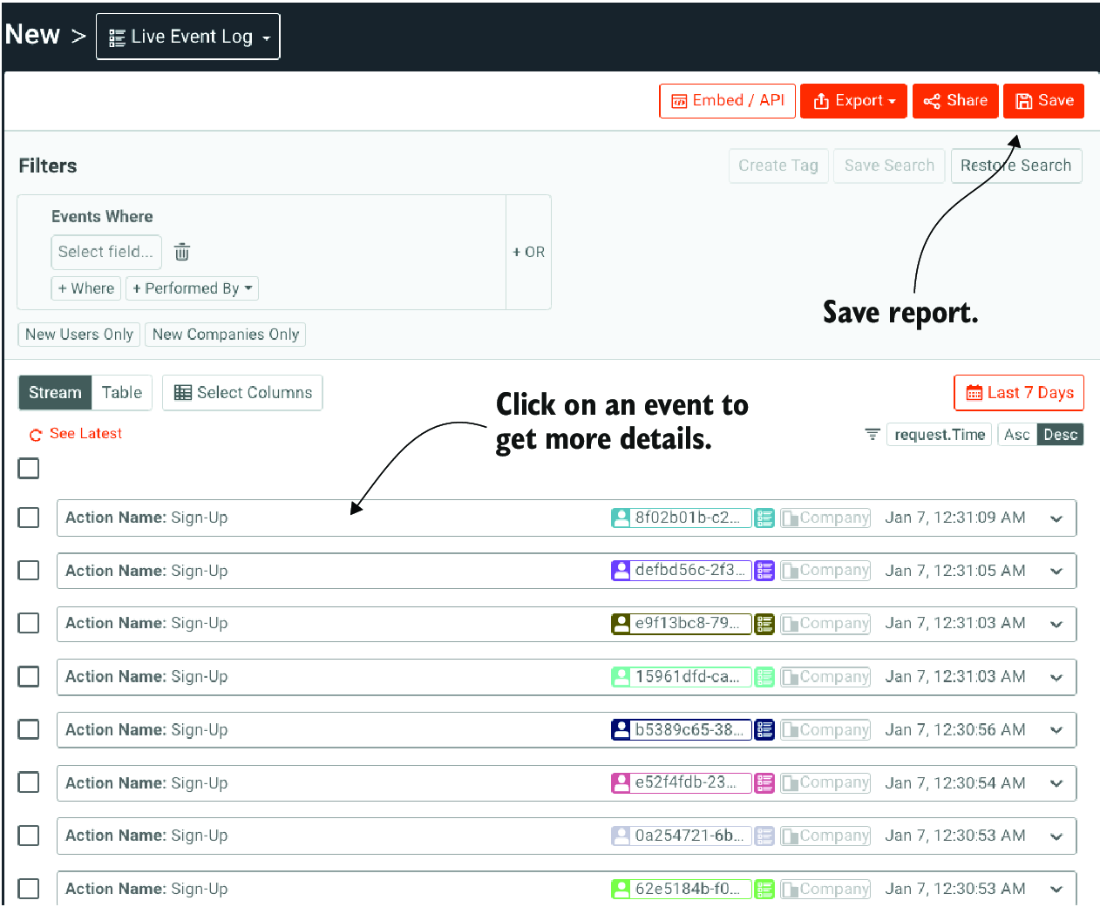
Creating a time series report to view new user sign-ups in Moesif
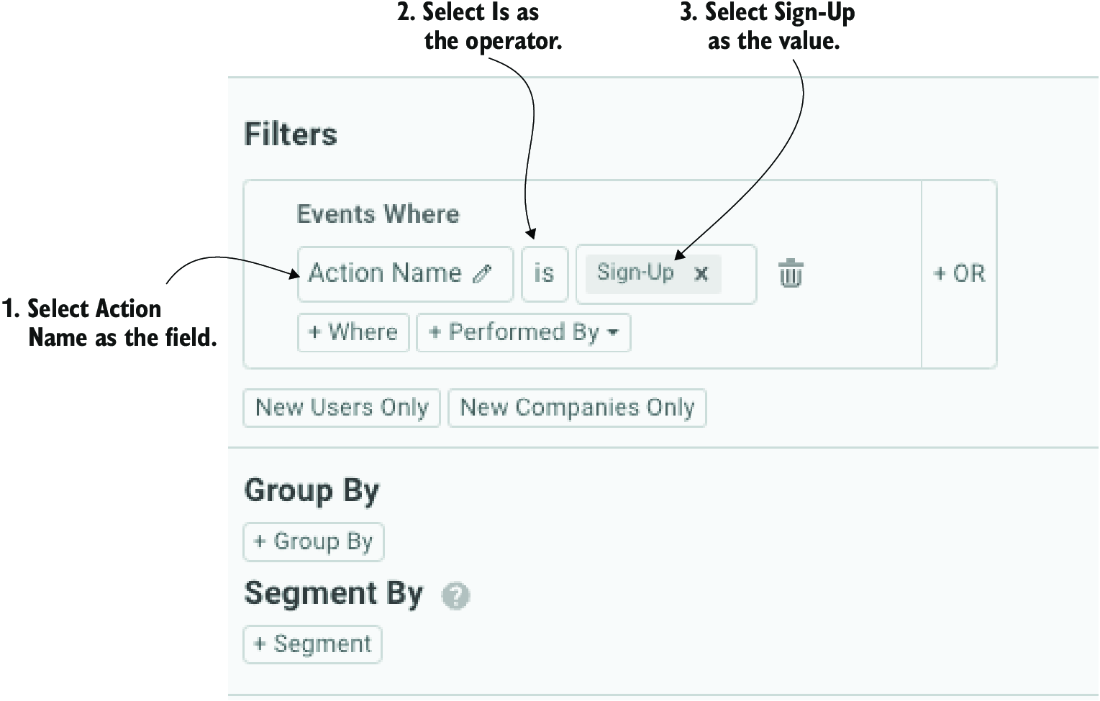
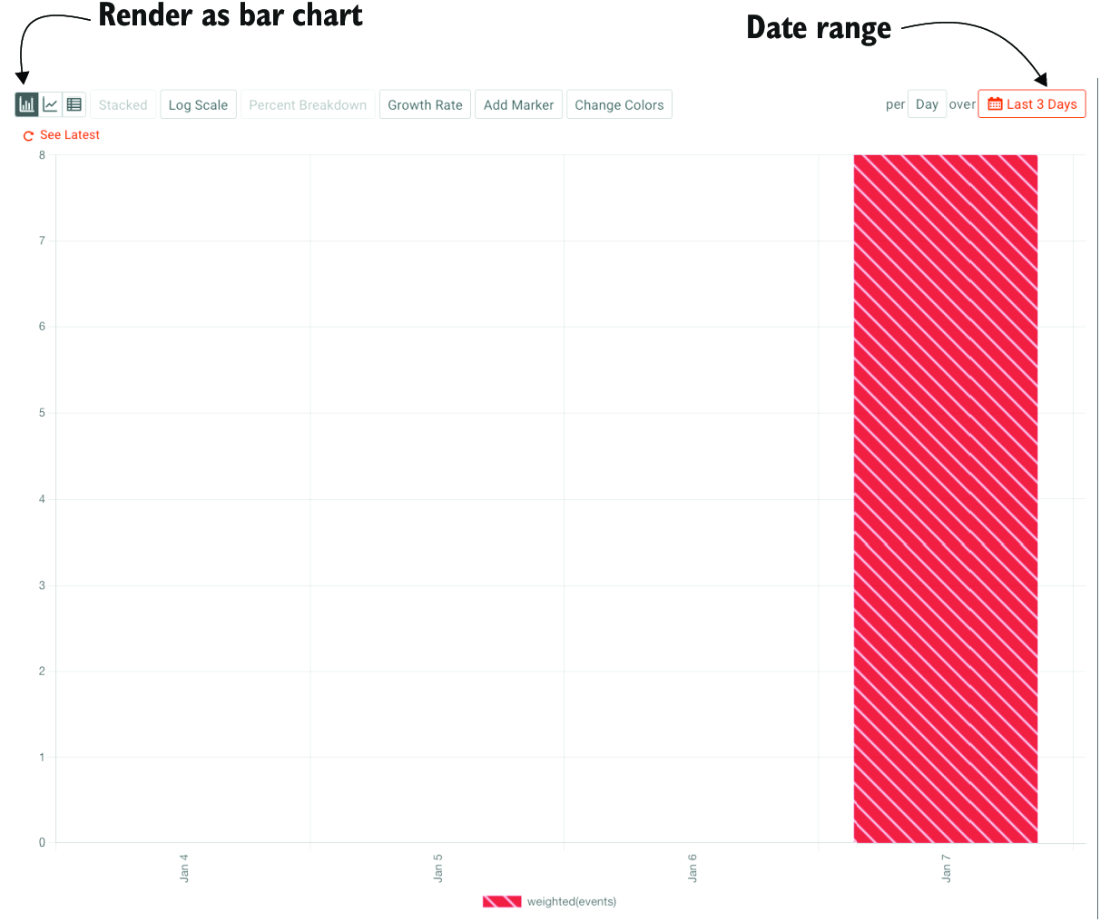
Bar chart showing the trend of sign-ups over the past three days
Report criteria for the report on recently signed-up users
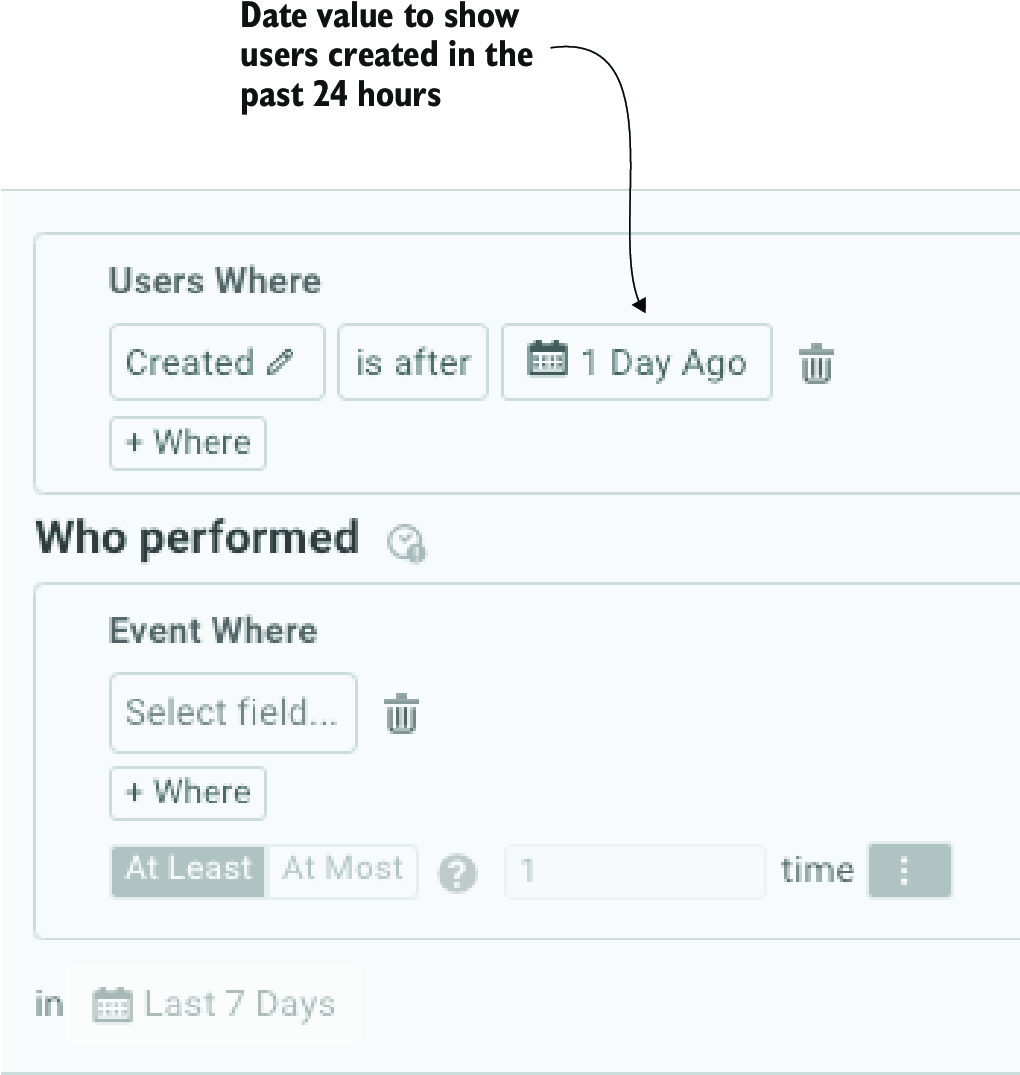
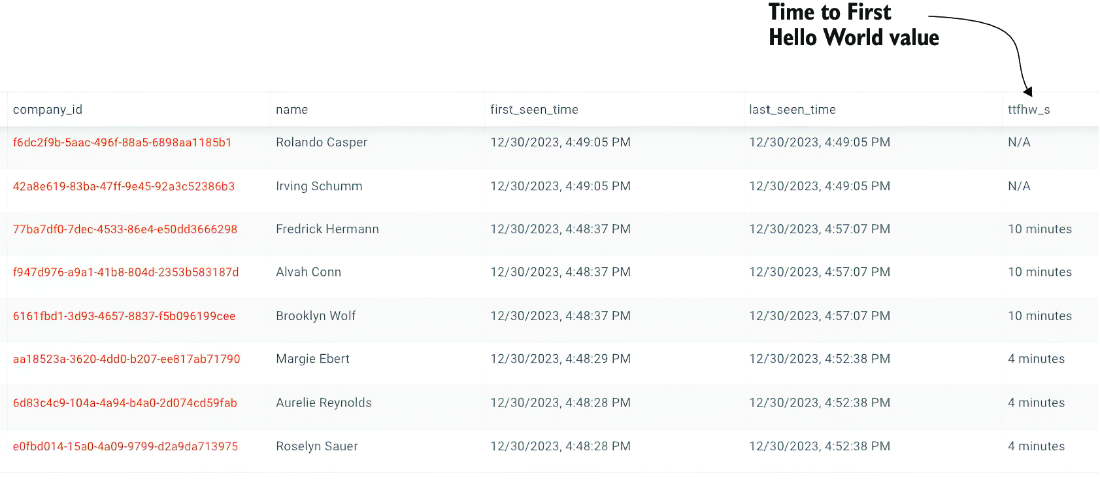
Details of recently signed-up users
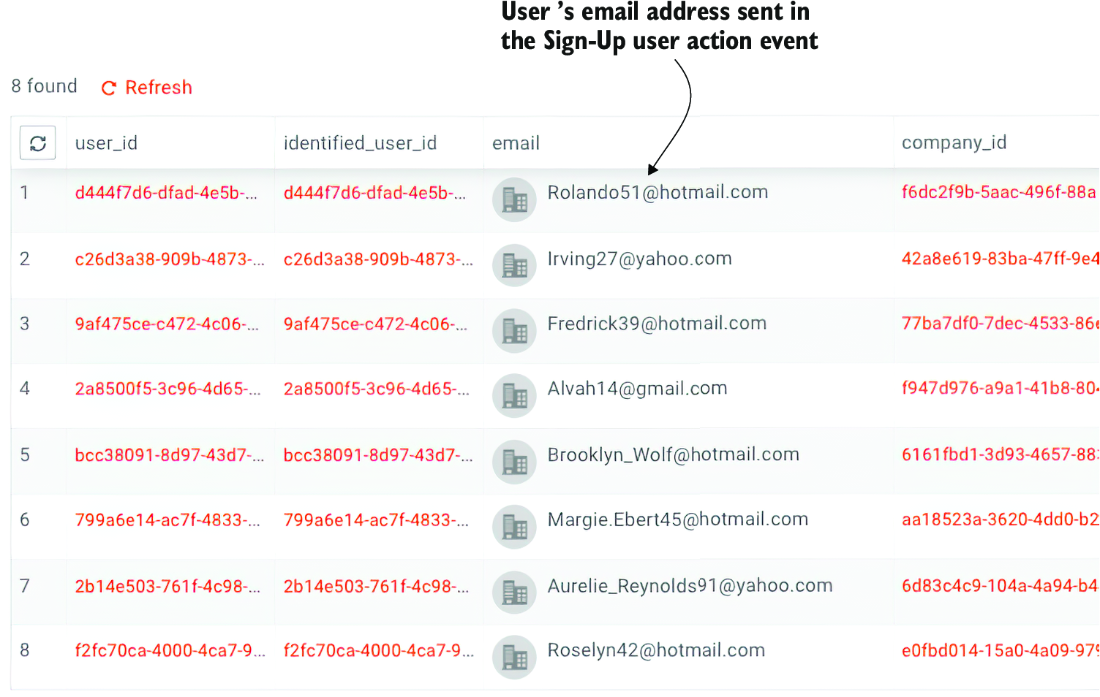
TTFHW value on the lookup report for recently signed-up users
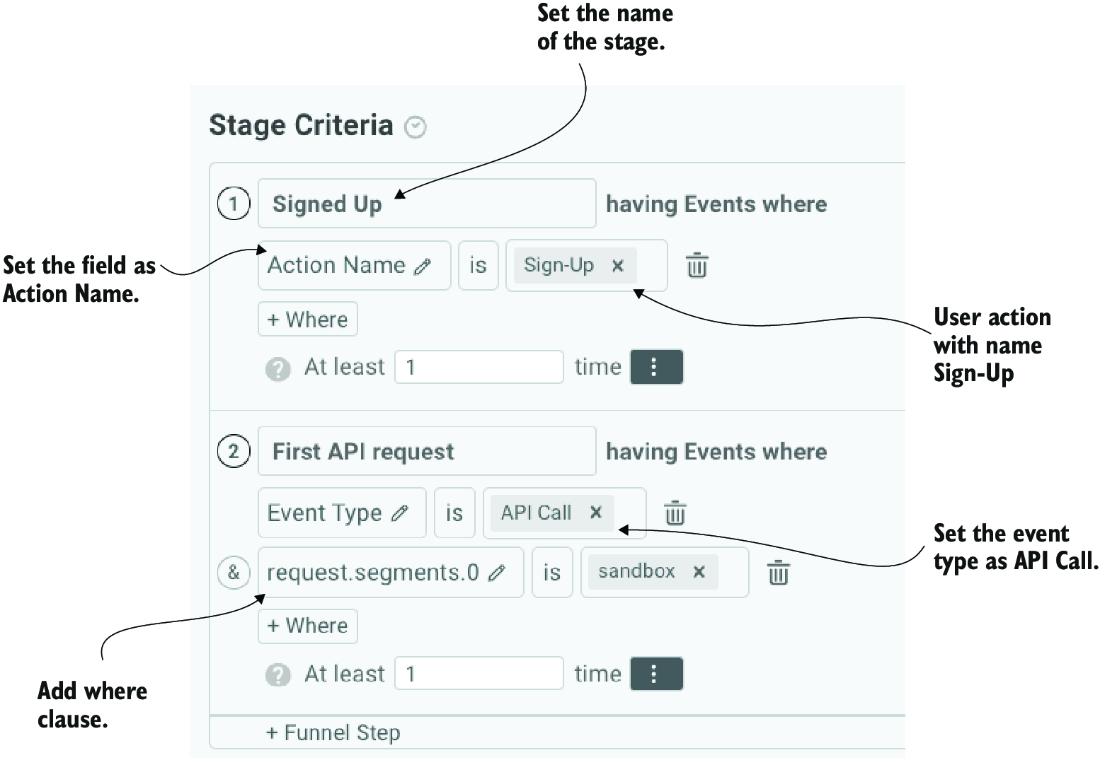
Setting the criteria for TTFHW funnel analysis
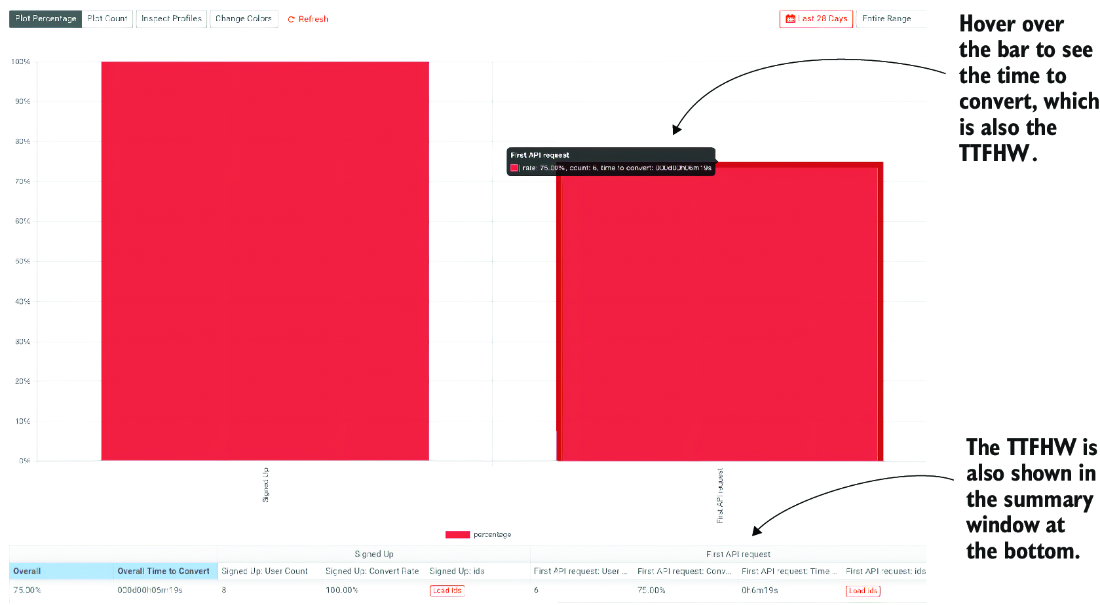
In this example run, the TTFHW for the group of six users who went on to make API calls after signing up is 6 minutes 19 seconds.
DAU criteria to show active users as those making API calls with an /api base path
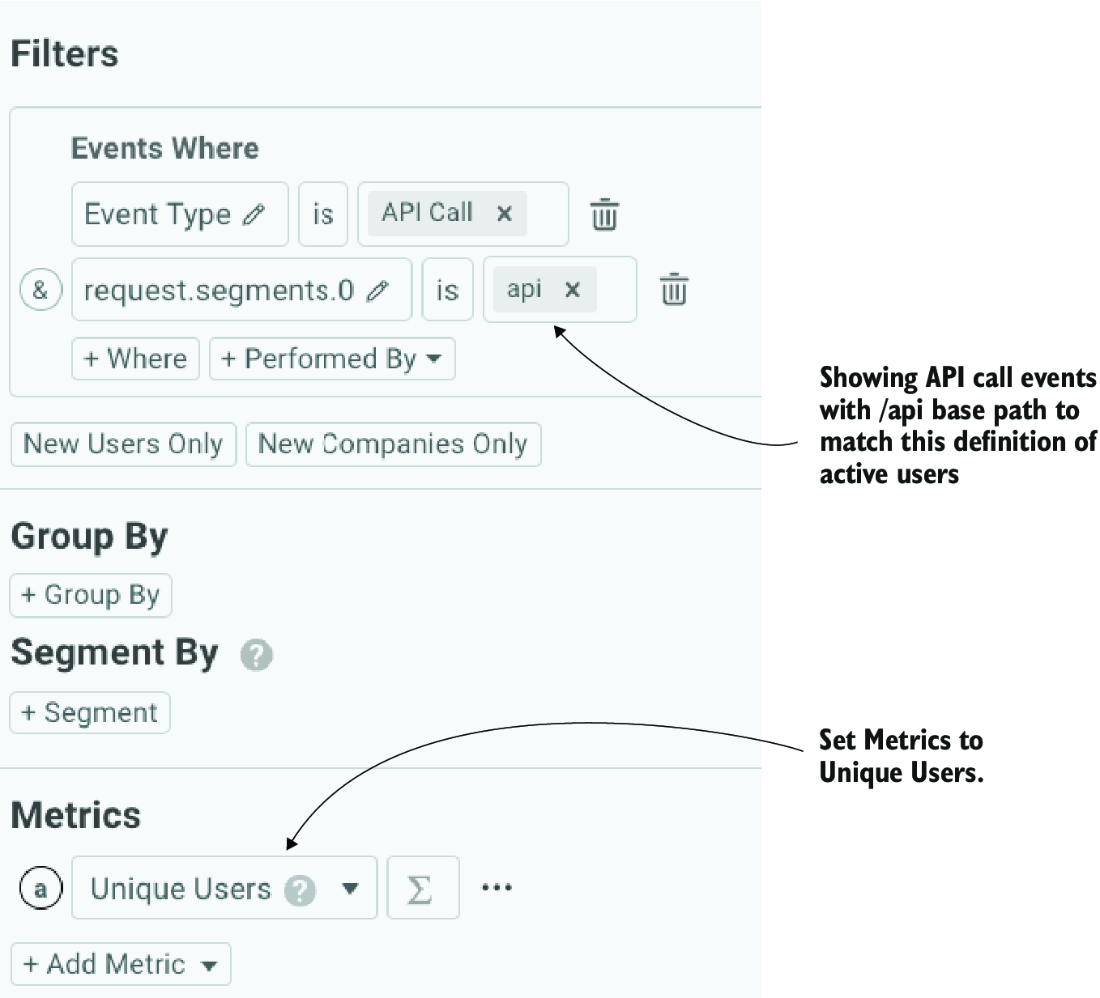
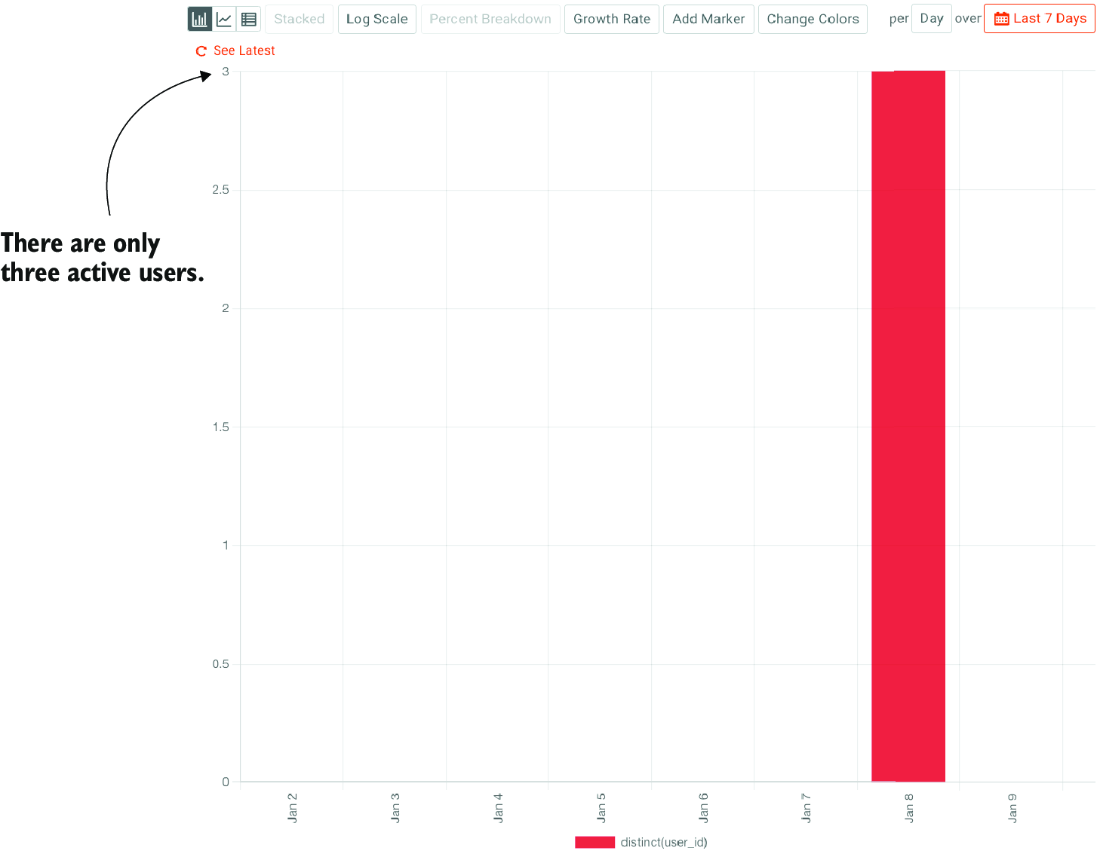
Example DAU time series chart
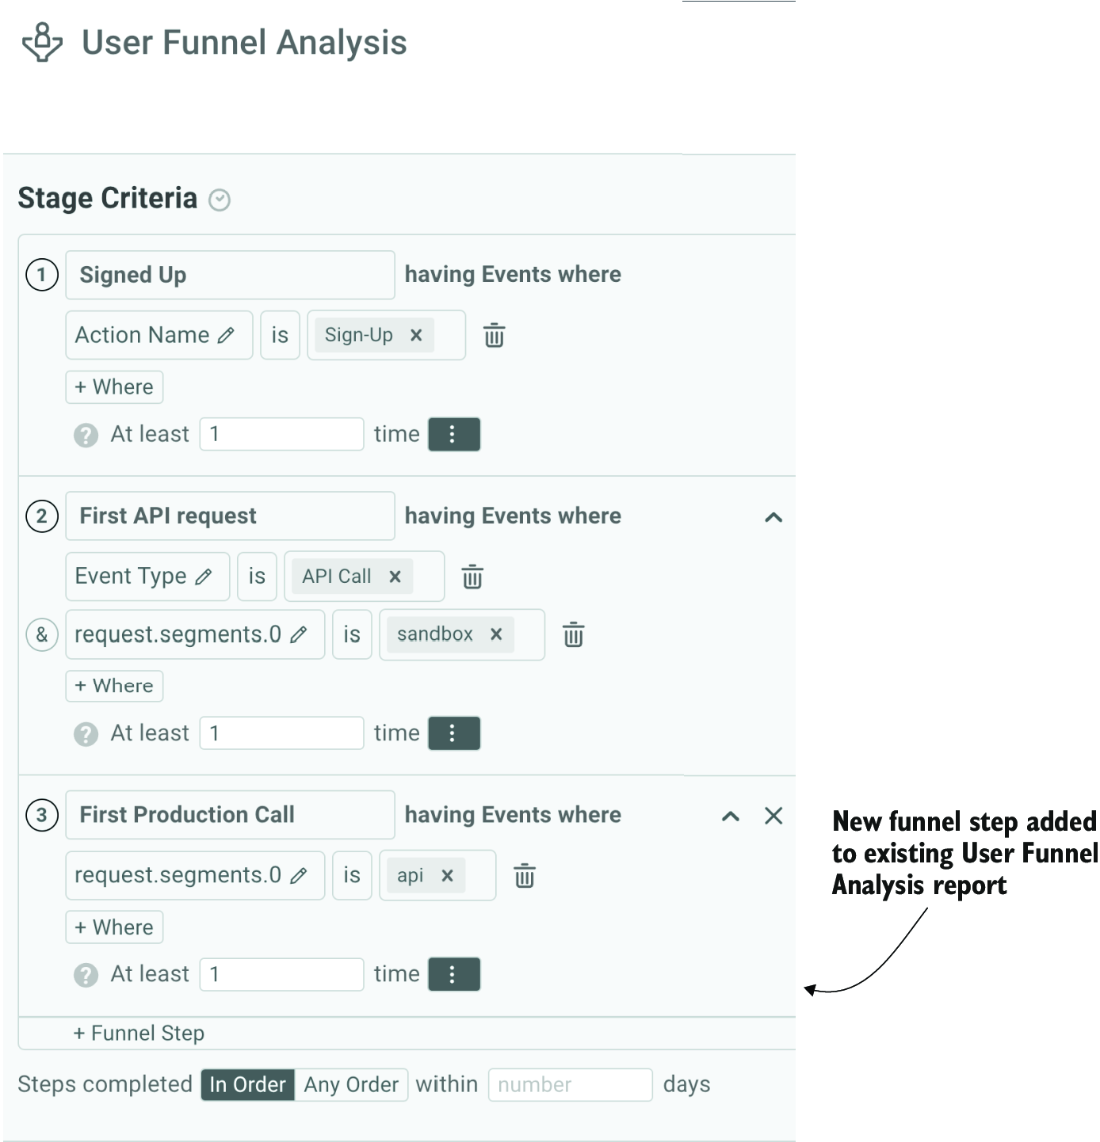
Add an additional criteria step, First Production Call, to the User Funnel Analysis report to update it to show the TTFT value.
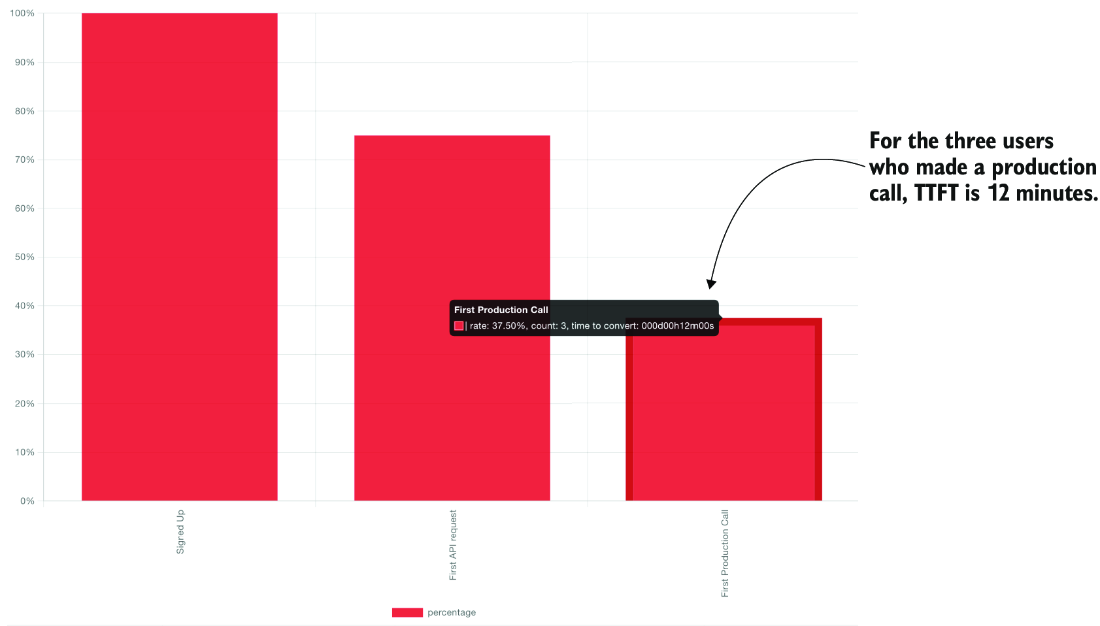
Updating the User Funnel Analysis chart to show the TTFT
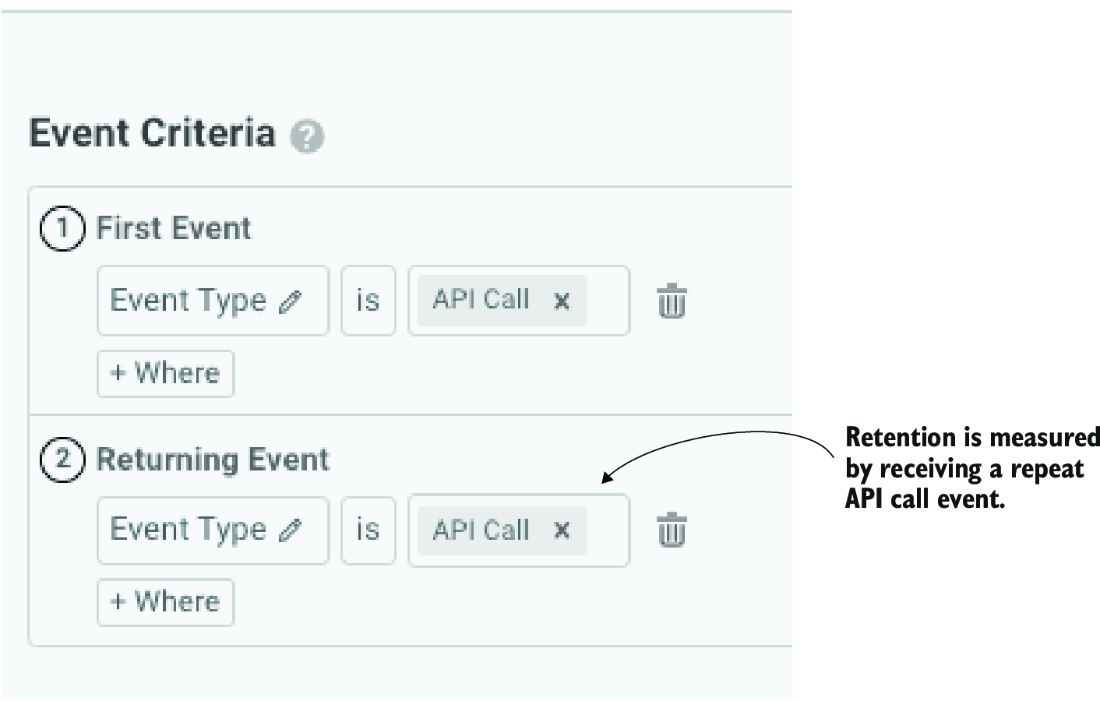
Setting the user retention chart criteria
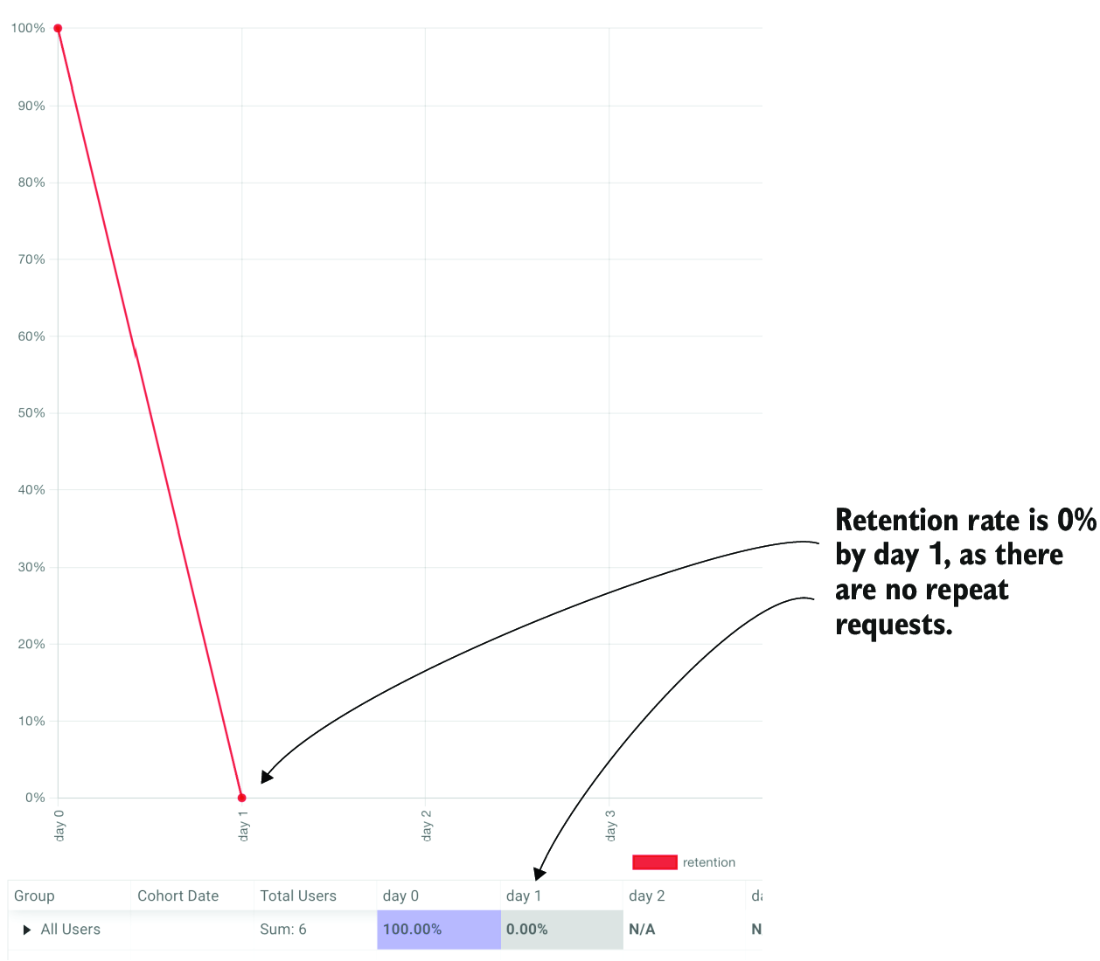
User retention chart
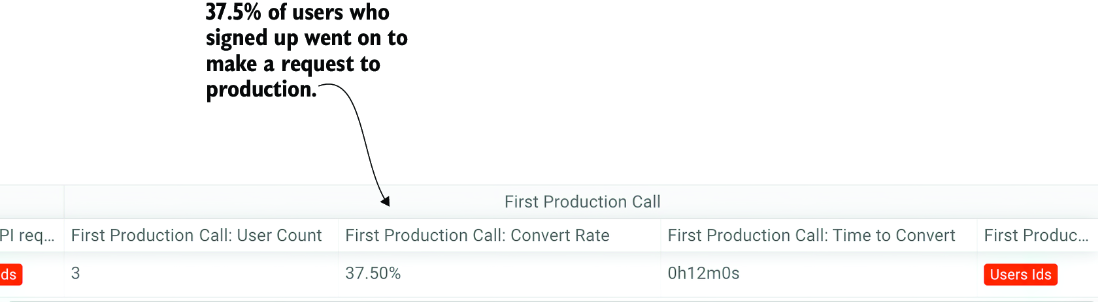
The User Funnel Analysis report shows the conversion rate of users who make a production API call.
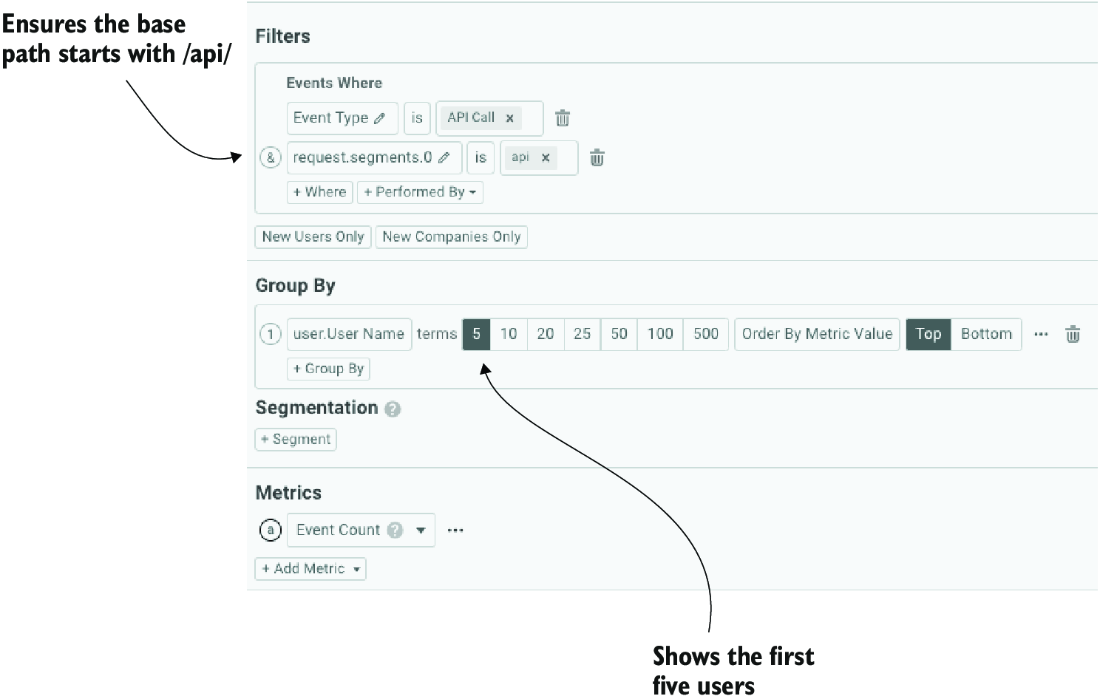
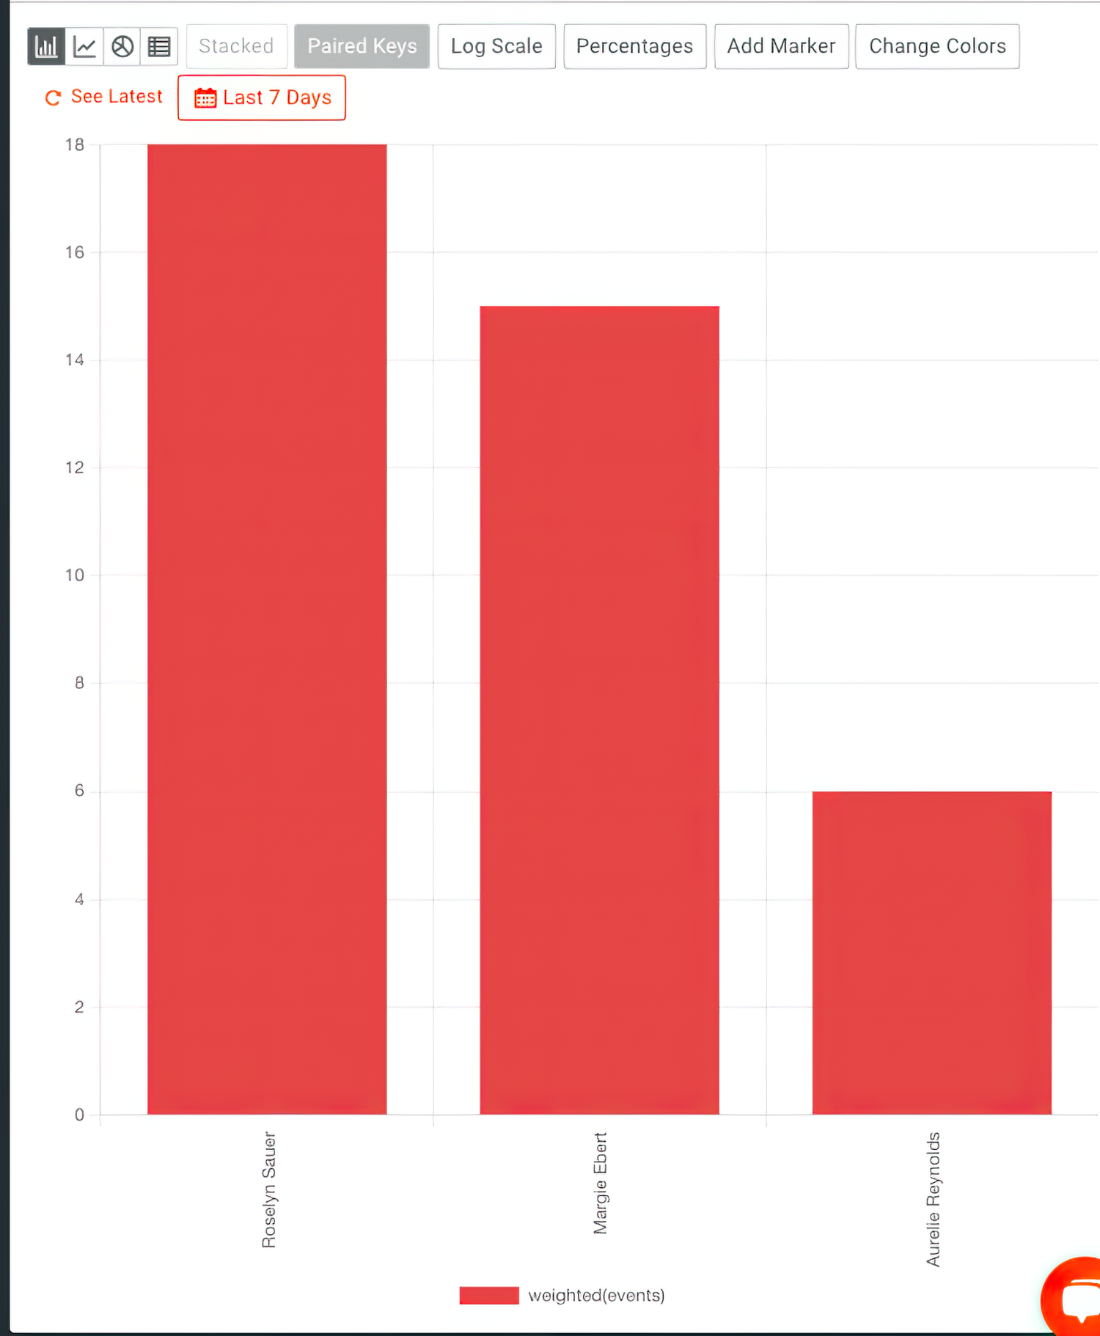
Criteria to show the top five API users in production criteria based on the number of API calls they make
Top API users by usage
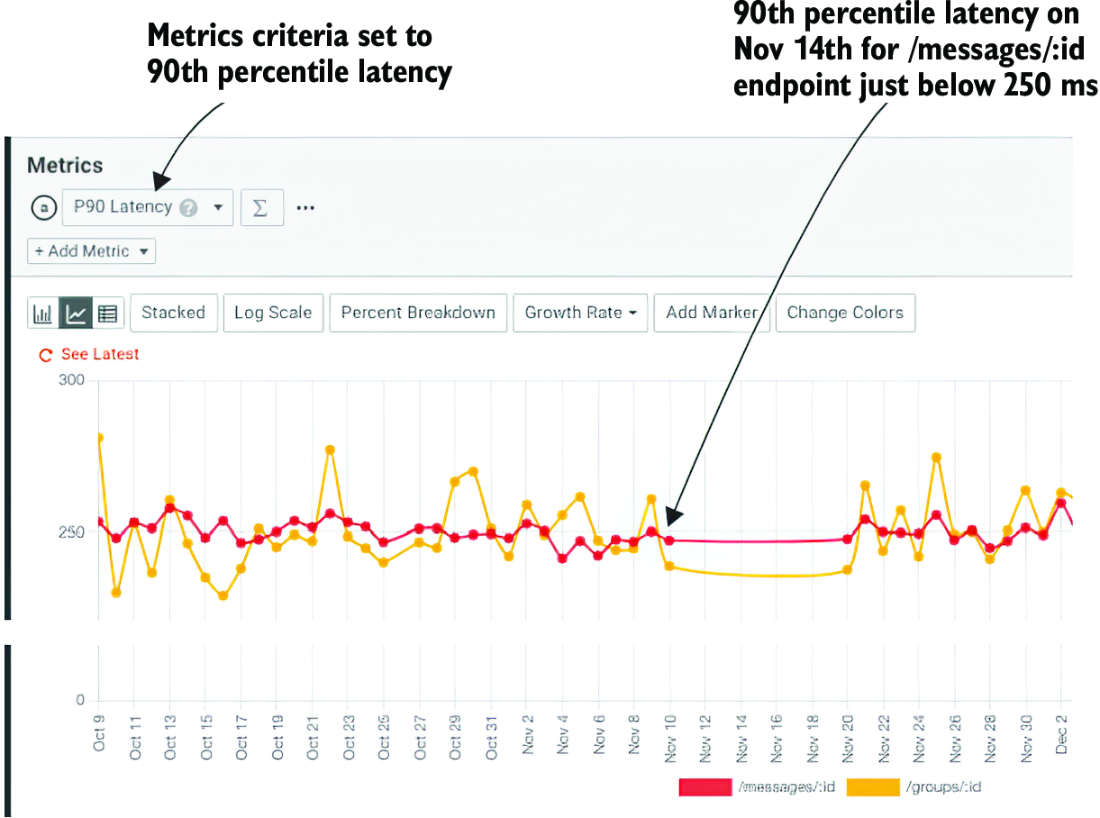
Example latency chart in Moesif, tracing the 90th percentile latency of two endpoints /messages/:id and /groups/id
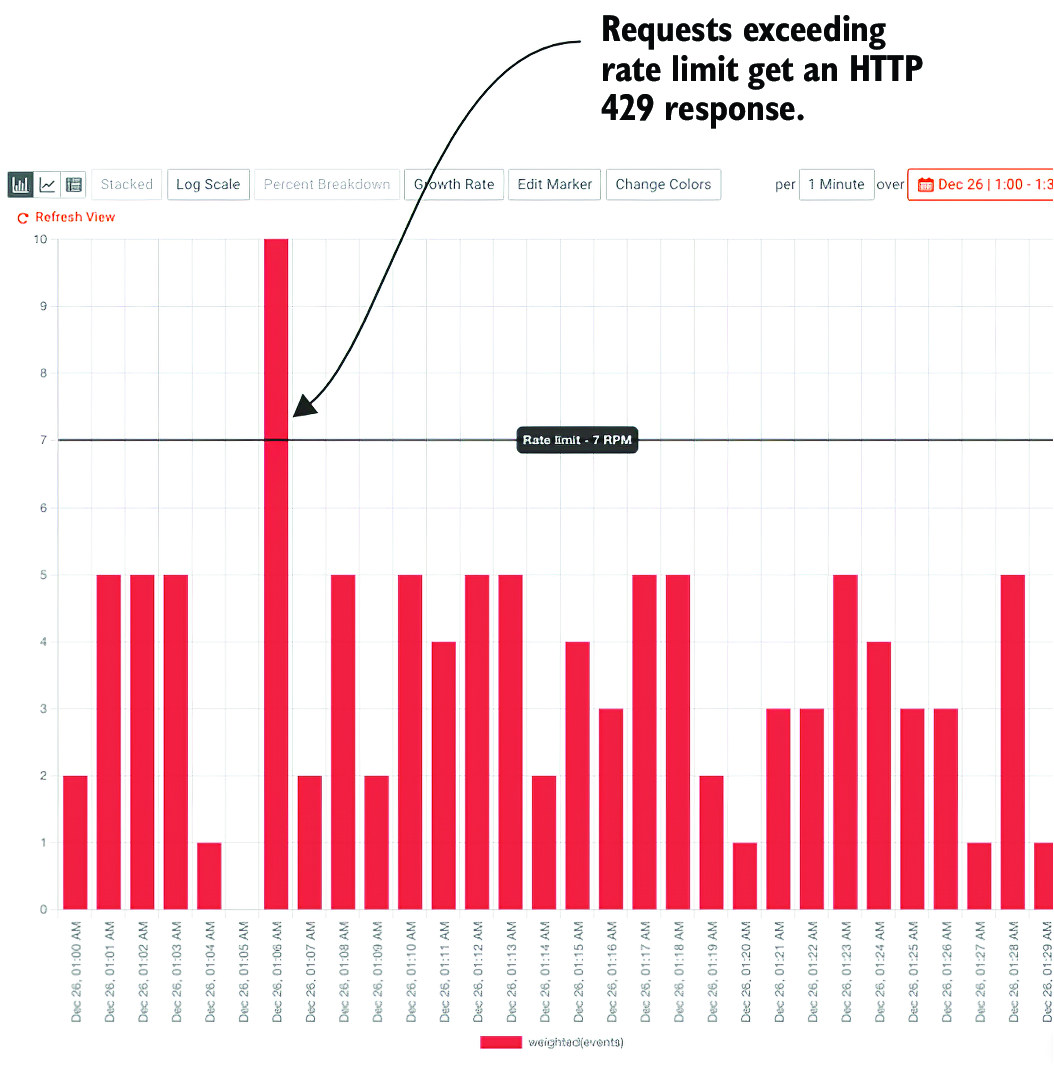
Time series report showing requests per minute and a rate limit marker
Summary
- API product metrics provide a basis for decision-making and benchmarking API product improvement goals.
- A developer journey map visualizes the process that developers go through to discover and use your API. Drawing a developer journey map helps you define the important product metrics to capture at each stage in order to paint a picture of the developer experience.
- Using an API product analytics tool helps you capture, visualize, and share important product metrics with your team. These product metrics include new user sign-ups, TTFHW, DAU, TTFT, user retention, conversion rate, and top API consumers.
- The RED method is a popular monitoring formula that can be applied to API technical performance monitoring. It captures the request rate, error rate, and duration.
- Rate limits indicate the saturation point of your API, and you should set them to protect your API from excessive usage that can lead to a poor user experience.
- To set monitoring and alerting, you need to define the SLOs for your API.

 Automating API Delivery ebook for free