15 Kafka monitoring and alerting
Kafka is built for fault tolerance, but sustained performance and reliability depend on thoughtful monitoring and alerting. The chapter frames failures as any degradation of full functionality and shows how good observability shortens detection and root-cause time. It emphasizes watching both Kafka internals and the underlying infrastructure (CPU, memory, disk, and network), maintaining headroom for rebalancing and failure scenarios, and interpreting metrics as trends rather than snapshots so that temporary spikes don’t trigger unnecessary interventions while prolonged pressure prompts scaling.
On the broker side, the most critical health indicators include under-replicated partitions, ISR thresholds, offline replicas, and reassignment activity, complemented by follower lag, topic-level traffic, rejected-record counts, purgatory backlog, log flush latency, and offline log directories. Network health is summarized by processor idle percent and request/error timings. Client monitoring spans connection stability and failed authentications, producer error and throttle rates, in-flight requests and latency, and consumer poll cadence, rebalance behavior, partition assignment, commit latency, and especially consumer lag and records lead. For Kafka Connect, operators track worker/connector/task status and error rates (including DLQ activity), while Kafka Streams benefits from thread/task metrics (starts/stops, processing rates, latencies) and dropped-record visibility, plus processor-node and state-store specifics.
Effective alerting focuses on a curated set of high-signal metrics, uses visualization and aggregation to set meaningful thresholds, and avoids alert fatigue by tuning sensitivity and starting conservatively, allowing self-healing to act before escalation. Alerts should be enriched with context, runbooks, and pointers to relevant dashboards, and may trigger automated remediation such as restarts or scaling. Finally, deployment context shapes monitoring priorities: on-prem demands deep hardware and redundancy checks; VMs add hypervisor contention; public cloud brings latency and instance variability; Kubernetes requires watching both platform and JMX-exported Kafka metrics; and managed services still need application-level oversight and quota awareness. Across all environments, security telemetry—especially authentication failures and access anomalies—remains essential.
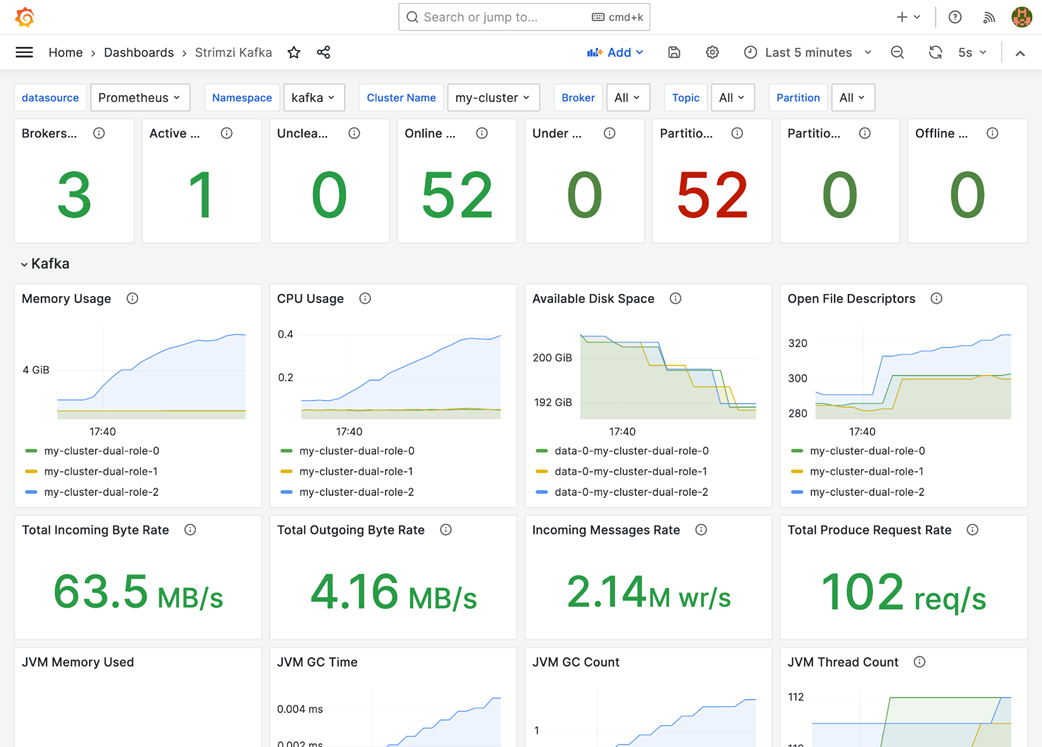
A simple Grafana dashboard for Broker monitoring.
Summary
- Monitoring Kafka is vital for optimal performance and reliability.
- Infrastructure monitoring is crucial as performance issues can stem from insufficient CPU, memory, storage, or network capacity.
- Disk and network utilization should stay below 60% for effective partition rebalancing and to prevent data movement issues during broker failures.
- Contextualizing metrics is important; prolonged high resource usage may indicate a need for scaling rather than just temporary spikes.
- Kafka broker metrics, categorized under domains like kafka_server and kafka_log, clarify their origin and significance.
- Key metrics such as under-replicated partitions and under-minimum in-sync replicas should ideally be zero for broker health and cluster reliability.
- Metrics related to request types and rejected messages help identify bottlenecks, emphasizing balanced load distribution among brokers.
- Monitoring network processor metrics is essential; a low average idle percentage can indicate broker overload, requiring immediate resource scaling.
- Client metrics are critical since even a strong Kafka cluster relies on clients for data production and consumption.
- General client metrics focus on infrastructure health, as CPU and network limitations can lead to processing delays affecting data reliability.
- Producer metrics like record error total and request latency avg are vital for identifying message production issues.
- Consumer metrics, including consumer lag and rebalances, assess consumption efficiency and detect potential slowdowns.
- Kafka Connect metrics provide insights into connector health, highlighting the need to monitor dependencies on external systems.
- Kafka Streams metrics, such as processed records and processing duration, offer insights into application performance for early issue detection.
- Alerts are automated notifications based on predefined thresholds to detect anomalies early and reduce service disruptions.
- Avoid alert fatigue by setting meaningful thresholds and smoothing metrics to ensure alerts reflect real issues.
- Enhancing alerts with contextual information aids in efficient problem-solving during high-pressure situations.
- Deploying Kafka on physical hardware provides control but requires monitoring of system components like disk health and CPU utilization.
- Kafka on virtual machines introduces complexities from resource contention; monitoring should cover both Kafka and the virtualization layer.
- Cloud environments offer scalability but pose challenges like network latencies and instance performance variability; monitoring should focus on network throughput and instance health.
- Monitoring Kafka in Kubernetes involves using tools like Prometheus and Grafana while tracking resource usage, with alerting based on critical thresholds.
- In managed Kafka services, while infrastructure is handled by providers, monitoring application-level metrics like consumer lag and message throughput is essential for meeting service-level agreements.

 Apache Kafka in Action ebook for free
