4 Evaluating what makes a good recommendation
Evaluating recommender systems is less about finding an objective “right answer” and more about comparing alternatives in a way that supports product and business decisions. Because user preferences are partly hidden, shift over time, and are shaped by context and presentation, offline metrics are only approximations of real user behavior. The chapter emphasizes that evaluation is useful precisely because it helps teams communicate whether a model is worth shipping, iterating on, or abandoning.
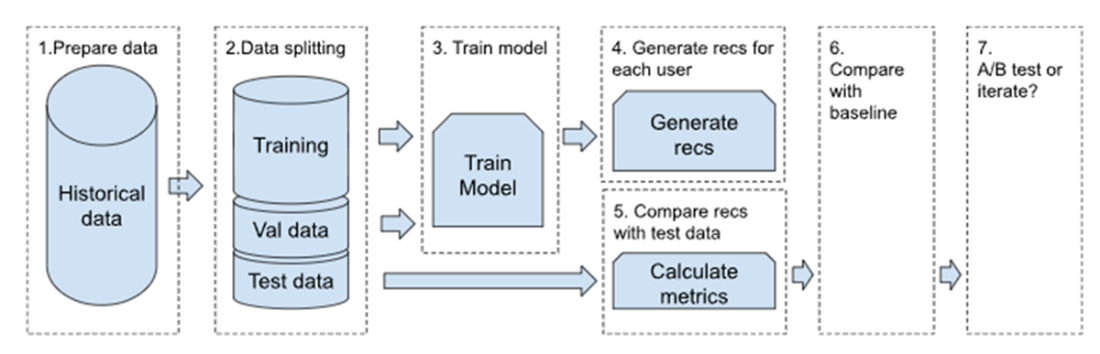
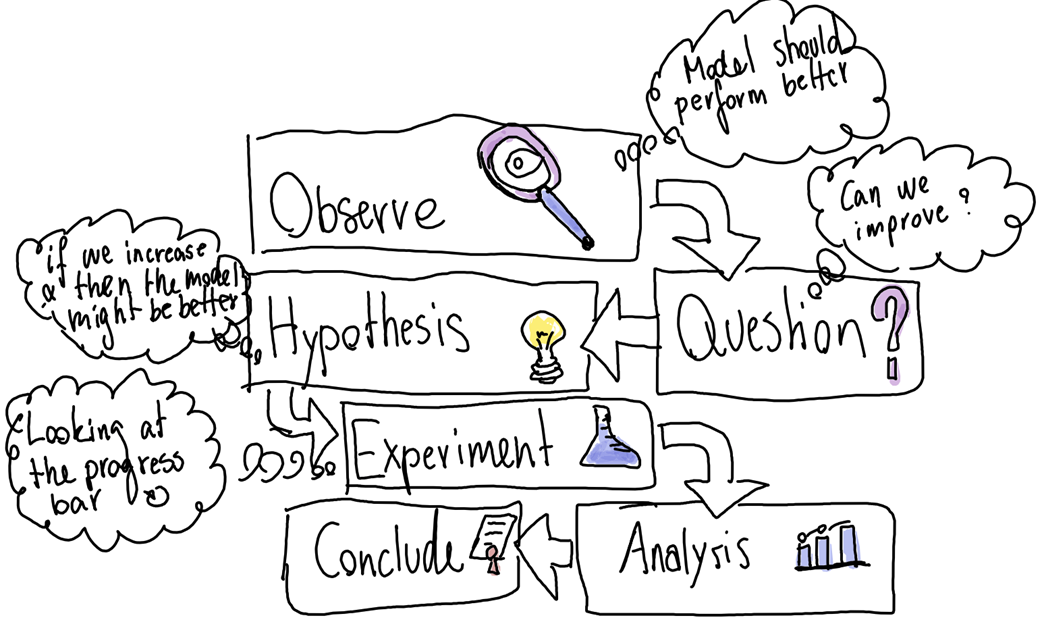
A good evaluation workflow starts with historical interaction data, split temporally so older behavior trains the model and newer behavior tests it. The model then generates recommendations for the test users, and those recommendations are compared with a relevance set built from what users actually liked in the holdout period. The chapter presents offline evaluation as an experiment-driven process: define a hypothesis, run the pipeline, measure the results, and compare them against baselines such as random or popularity-based recommendations before drawing conclusions.
The metrics themselves are organized around different notions of quality. Accuracy metrics like precision, recall, and hit rate measure whether relevant items appear; ranking metrics like NDCG, MRR, and MAP measure whether relevant items are placed near the top; and beyond-accuracy metrics such as coverage, diversity, and serendipity capture whether the system serves a broad and useful experience. The chapter also stresses evaluating by user segment and by pipeline stage, since cold-start users, power users, retrieval, filtering, scoring, and re-ranking all require different expectations and metrics. In the end, the goal is not a perfect score but a balanced, decision-ready view of how well the recommender serves users and how its trade-offs align with the product.
A recommender system can never know what the user truly wants. The user hasn't seen every item in the catalog, so there might be perfect recommendations we're not aware of.
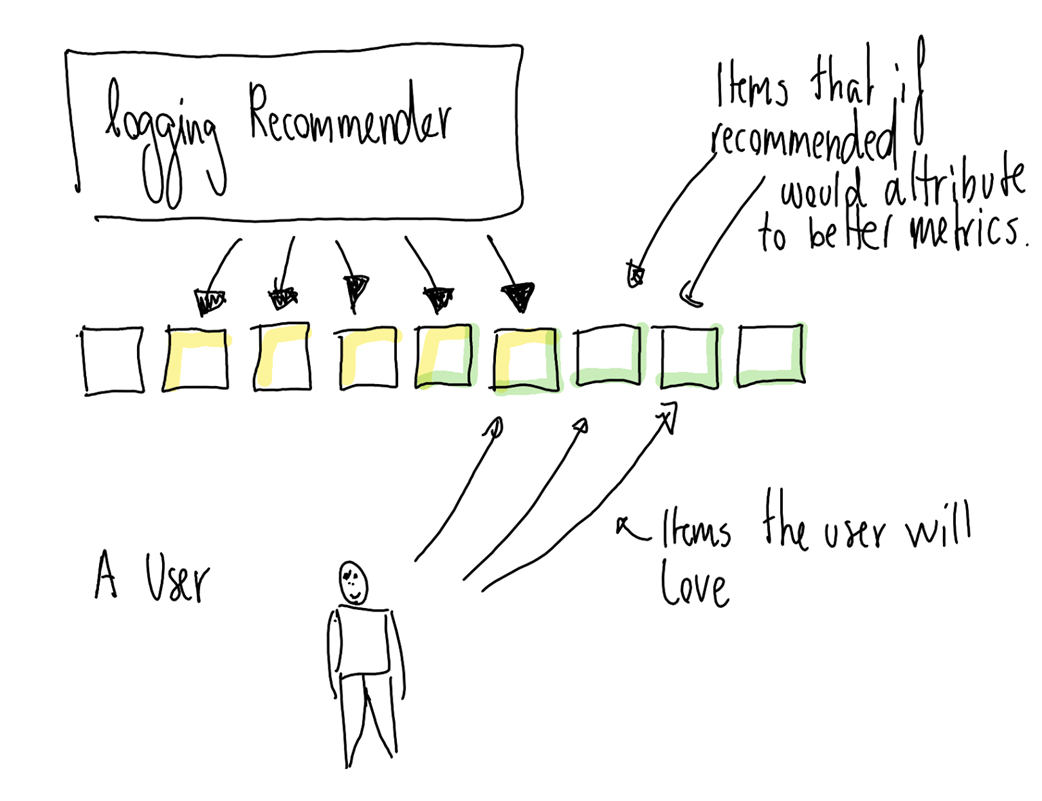
Three different content items that could be recommendations. Most recommendations are shown as a row of items.

The same three content items in a different order. Does this ordering create a better recommendation than figure 4.2?

A recommendation with seven items. If we're still only interested in travel, the first relevant item is now in position seven.

We need an evaluation function that takes recommendations as input and produces a quality score as output.

We want to create a function where a better recommendation produces a higher value.

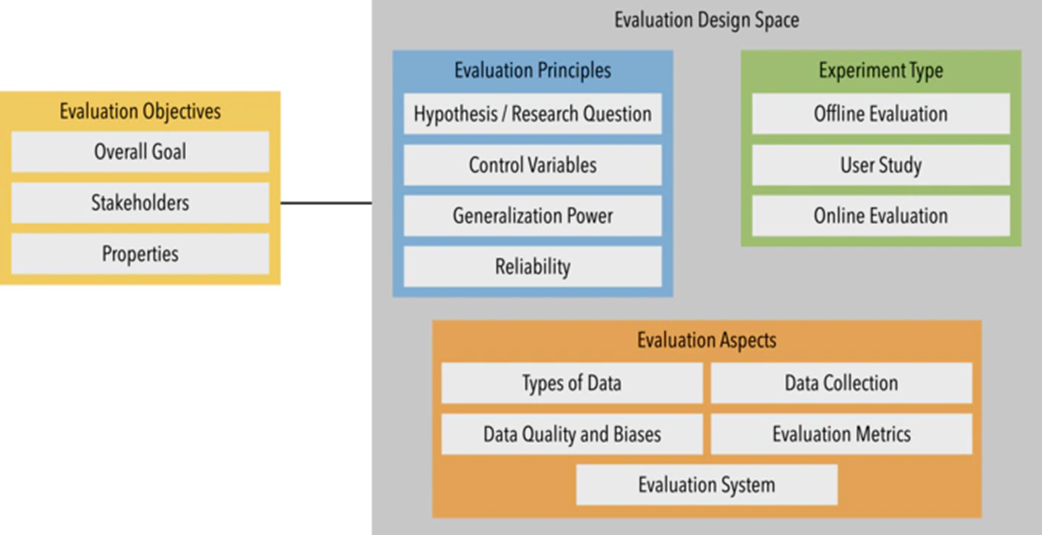
Framework for Evaluating Recommender Systems (FEVR) published in the “Evaluating Recommender Systems: Survey and Framework” by Eva Zangerle and Christine Bauer, 2022.
The offline evaluation workflow. Starting with historical data, we split it into temporal segments, train models, generate recommendations, calculate metrics, and compare them against baselines to decide whether to proceed to online testing.
The Scientific Method consists of six steps, from observation, question, and hypothesis to experiment, analysis, and conclusion.
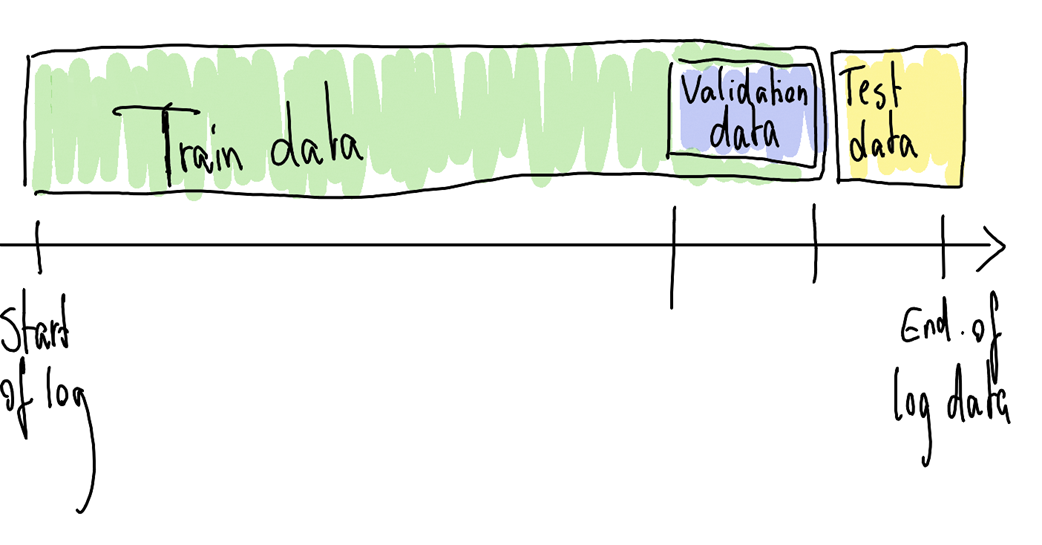
Splitting data on time. First part of the data is used to train the model, then a validation set is used to evaluate how good the model is with the training data. And lastly the test data, to test how good the trained model is.
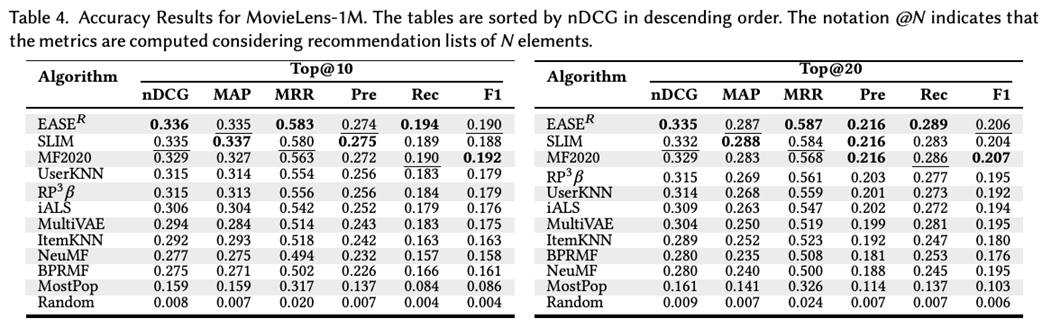
A table showing the different metrics of several recommender algorithms on the MovieLens-1M dataset. The table is found in the article "Top-n recommendation algorithms: A quest for the state-of-the-art."
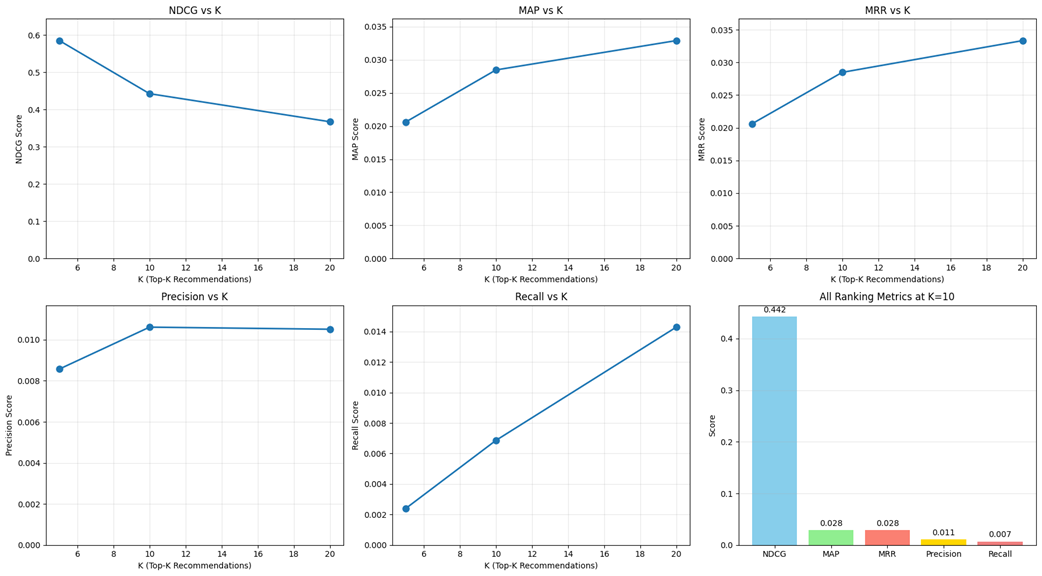
Diagrams showing how the different metrics change as you increase the number of items to recommend. In the industry, the number of items to show is often part of the business requirement.
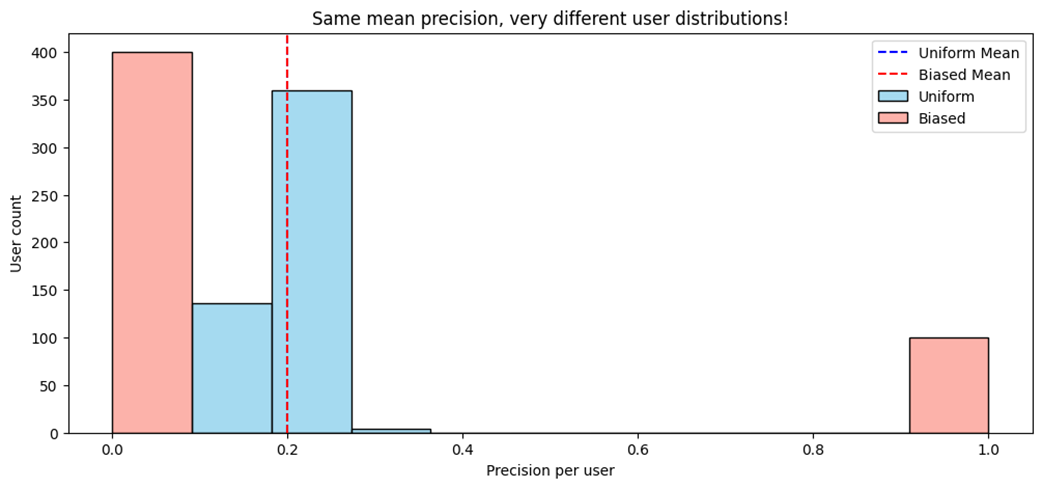
Mean precision is just one number and can encompass very different distributions.
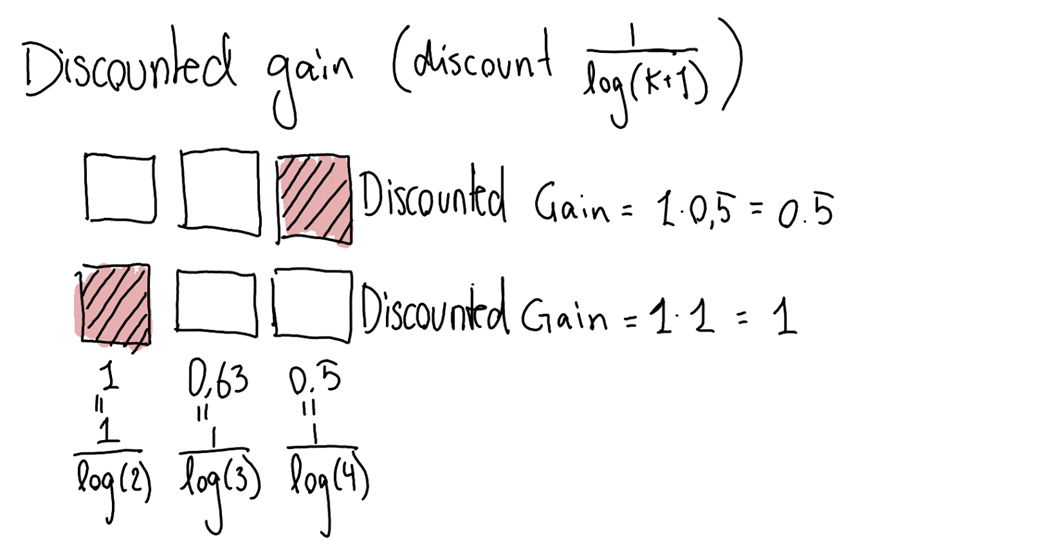
A simple way to calculate Gain is simply saying an item is relevant if the user consumed it or not. This means that the two lists of recommendations would have the same cumulative gain.

Recommendations with discounted gains.
Metrics across different K values.

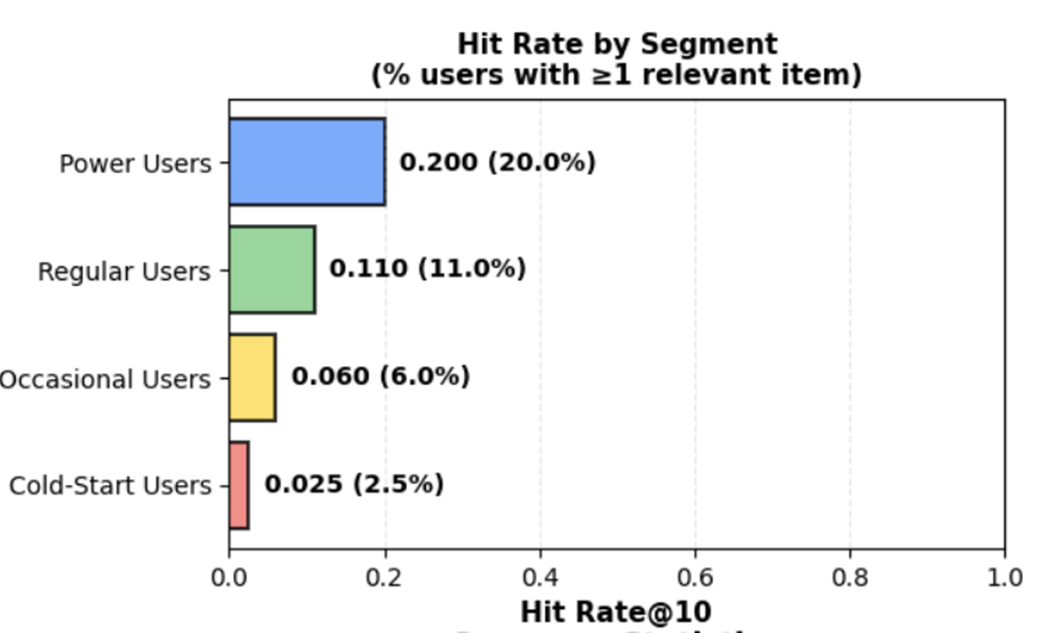
Hit rate divided over groups of users based on how many items they have consumed.
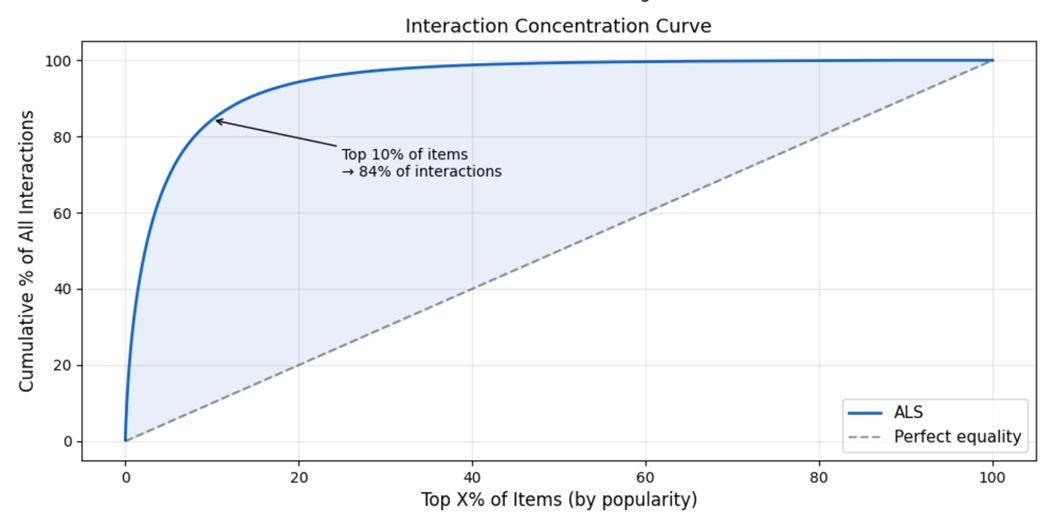
ALS recommends only a small percentage of available items.
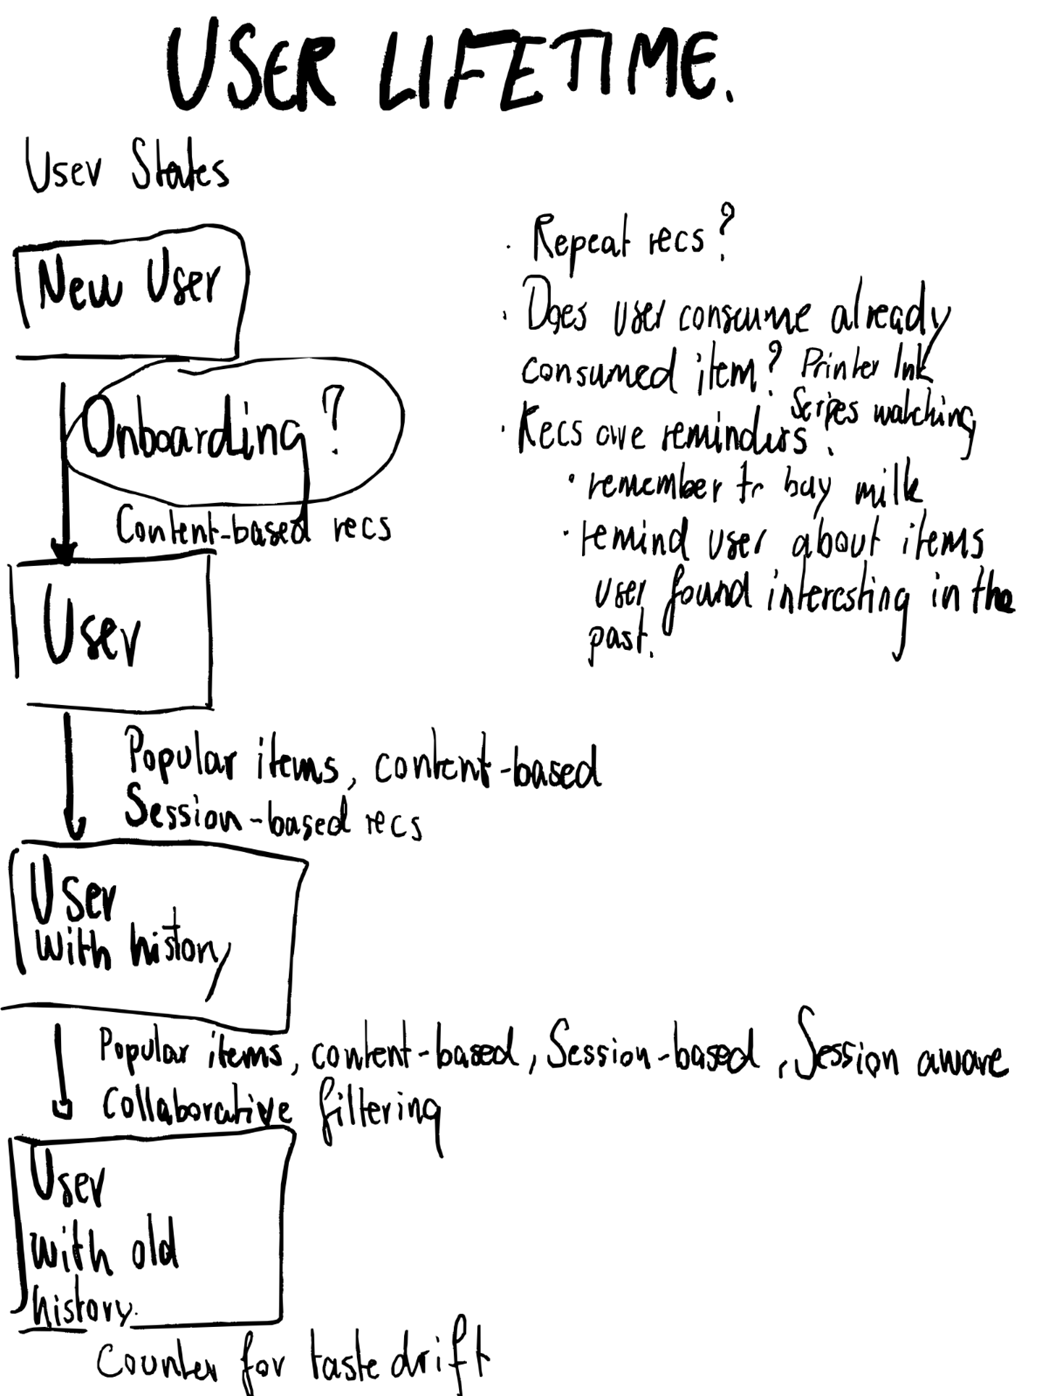
The different stages of a user's lifecycle, and which types of recommendations can be used at each stage.
Summary
- Recommender evaluation has no ground truth — we evaluate against a relevance set built from historical data, not against objectively correct answers.
- Evaluation is always comparative. A precision score is meaningless without a baseline to compare it against.
- Temporal splitting simulates real deployment: train on the past, test on the future. Cover full weeks to account for behavioral patterns.
- Start with a small sample to keep experiment turnaround fast, and use spot checks on known items to catch obvious problems early.
- Accuracy metrics (precision, recall, hit rate) tell you whether relevant items appear in the recommendations. Rank-aware metrics (NDCG, MRR, MAP) tell you whether they appear near the top.
- Always look at the distribution of metrics across users, not just the mean. The same average can hide very different user experiences.
- Beyond-accuracy metrics — coverage, diversity, and serendipity — capture dimensions that accuracy alone misses. A model with high precision but low catalog coverage may just be recommending popular items.
- Establish a baseline ladder: random (sanity check), popularity (surprisingly hard to beat), and simple personalization. Each step tells you what your model has learned.
- Each stage of a multi-stage pipeline needs its own evaluation: recall for retrieval, NDCG for scoring, coverage and diversity for re-ranking. End-to-end metrics measure the user experience; stage-specific metrics tell you where problems live.
- Evaluate across the user lifecycle. Models that perform well for power users may fail for cold-start users, and aggregate metrics will hide that gap.
- For cold-start users, the popularity baseline is genuinely hard to beat — and beating it by even a small margin is valuable, as those users are at the highest risk of leaving. For power users, the bar is higher, they expect personalization that goes beyond what's popular.

 AI Recommender Systems ebook for free
