4 Engineering system performance evaluations
The chapter explains that evaluating AI systems requires looking beyond model quality and examining the engineering stack that actually delivers predictions to users. A model can perform well offline yet still fail in production if it is too slow, too costly, fragile under load, or dependent on unreliable services. Because user experience and business outcomes are strongly affected by responsiveness, the chapter argues that latency, load time, reliability, and cost should be treated as first-class evaluation concerns rather than implementation details.
It then lays out the main performance metrics and how to interpret them across different parts of the system. Frontend metrics such as Time to First Byte, First Contentful Paint, Largest Contentful Paint, and fully loaded time capture how quickly content appears and becomes usable, while backend latency and model inference metrics reveal where time is spent in request handling, retrieval, generation, and rendering. For LLM and agent systems, additional measures like time to first token, tokens per second, prompt processing time, retrieval latency, tool-call success, loop rate, and cost per request are needed because the user experience is shaped by multi-step orchestration, not just one model call. The chapter emphasizes measuring these metrics together with resource utilization and percentiles so teams can locate bottlenecks and understand tail risks.
To test systems realistically before exposing users, the chapter introduces shadow traffic and latency degradation experiments. Shadow traffic duplicates real requests into a candidate system without changing what users see, making it useful for checking whether a new model or architecture can handle production conditions, though it cannot measure user behavior impact. Latency degradation experiments intentionally add controlled delay to measure how sensitive users are to slower experiences, helping teams identify guardrails for acceptable performance. Across both methods, the chapter stresses careful capacity planning, realistic test environments, and balancing trade-offs between speed, quality, reliability, and cost so that AI features are not only accurate, but deployable and valuable in practice.
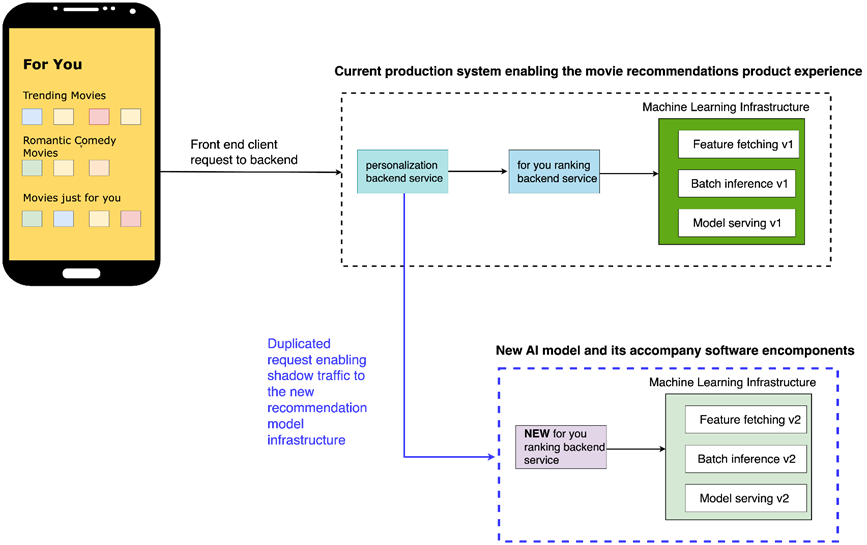
Illustrates how shadow traffic works where the current system design is invoked (black dotted box) and the new ranking backend service that invokes a v2 version of the model that is up evaluation being tested in the shadow system (blue dotted box).
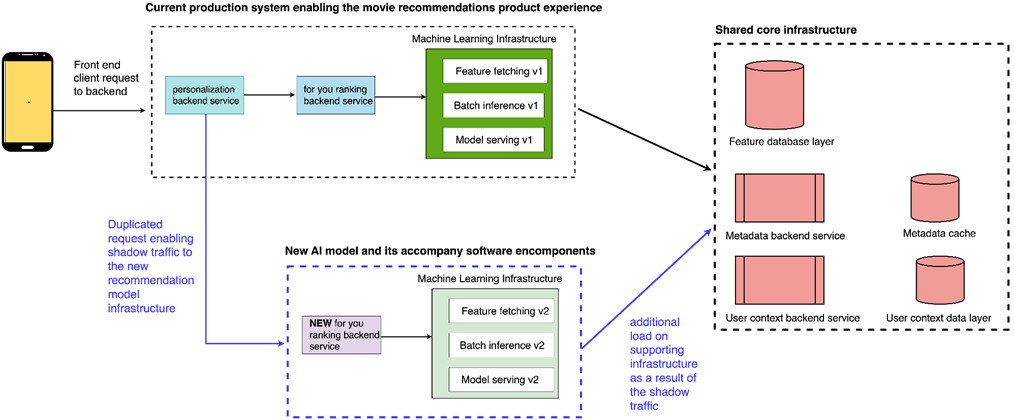
illustrates how shadow traffic adds additional load to the supporting infrastructure such as feature database layer, metadata services, caches and user context lookups. This is one of the primary risks of shadow traffic that's worth over communicating so that the machine learning or platform infrastructure teams aren’t surprised by an increase in requests as a result of the shadow traffic evaluation.
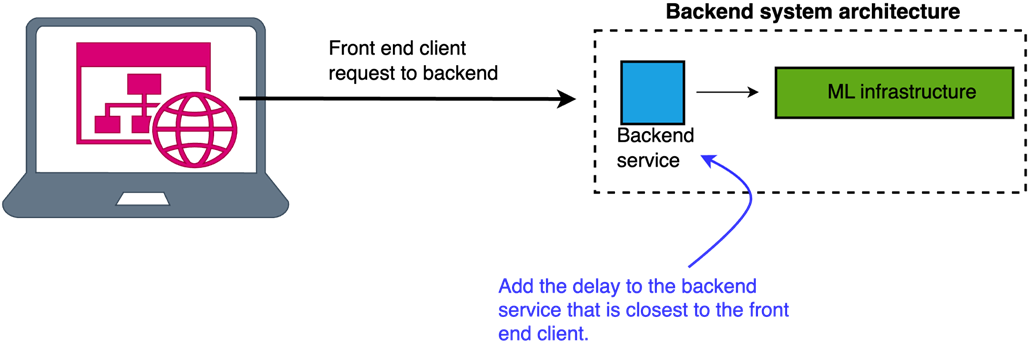
illustrates evaluating the impact of latency on a website rendered on a computer. The front end client code makes a request to the backend system, where the first backend service in that architecture includes a delay that represents latency. The delay will increase latency on the product, enabling evaluations to determine what degree of latency influences user engagement and product metrics. By adding varying degrees of latency, you can have multiple test variants evaluating whether 10ms or 20ms (for example) influence user engagement and key product metrics.
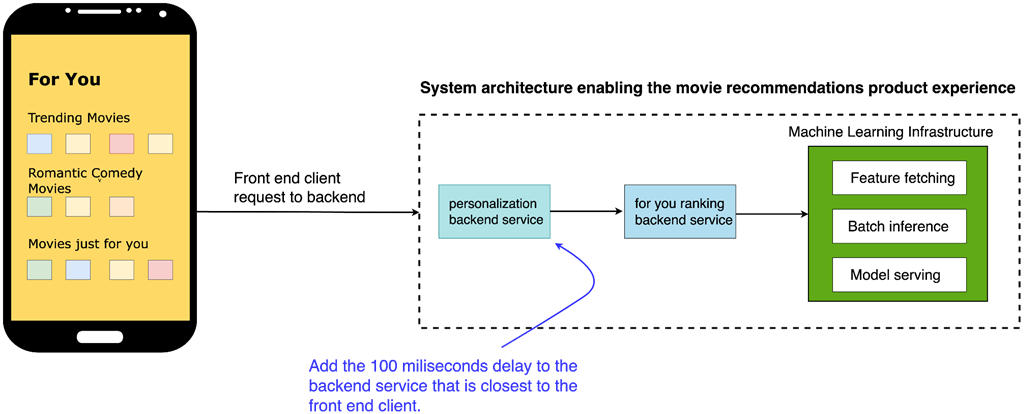
illustrates the system architecture for the movie recommendations use case in a streaming app. In this scenario, latency is injected at the backend service closest to the front-end client—the personalization backend service. This service sends a request to the 'For You' ranking backend service, which handles the steps required to fetch features, perform request-time inference or micro-batched inference, and serve the model to generate the 'Trending Movies,' 'Romantic Comedy Movies,' and 'Movies Just for You' rows on the product.
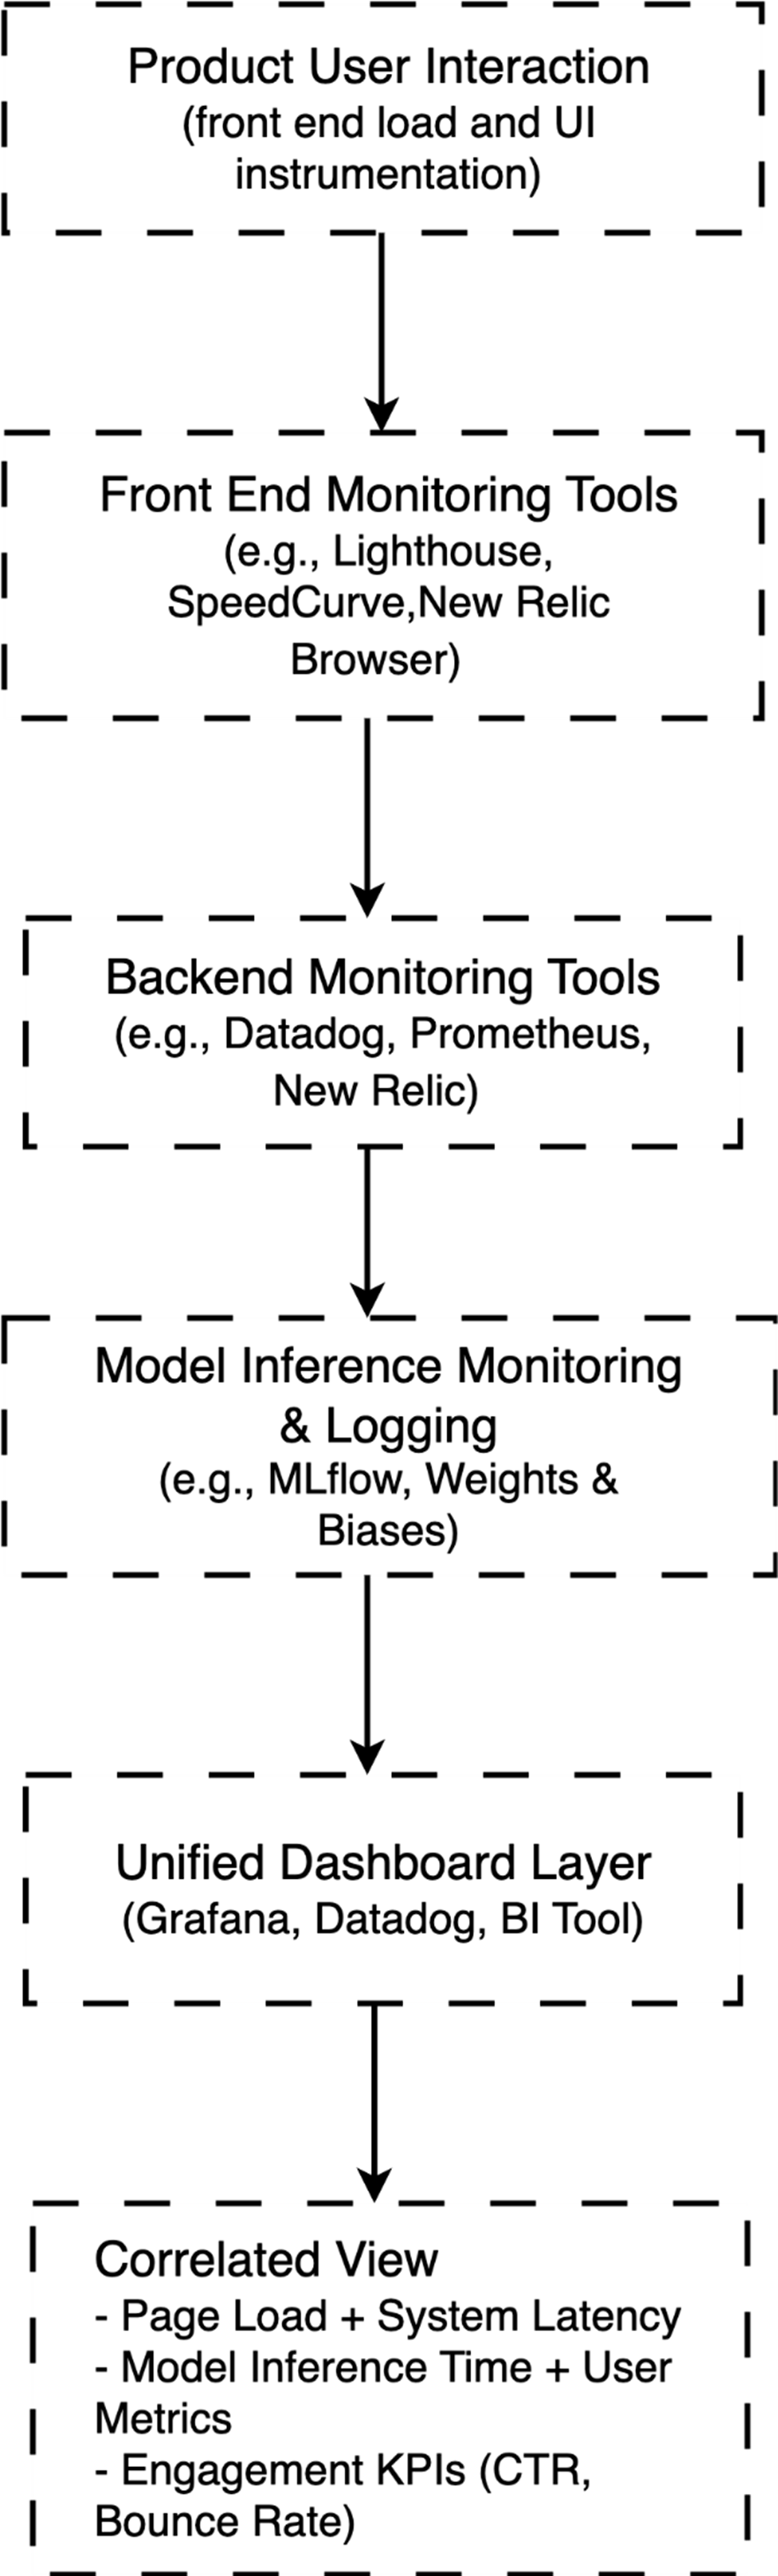
shows how user interaction flows through the frontend, backend, model inference service, and data layers, each contributing to overall system latency and user experience metrics. Metrics from every layer are collected and visualized in a unified dashboard, helping teams identify bottlenecks and evaluate the real-world performance of AI models. The diagram includes example tools like Lighthouse, Datadog, and TensorFlow Serving illustrate what technologies might be used at each stage.
Summary
- Engineering system performance evaluations help determine whether an AI-powered feature can be served reliably, quickly, and cost-effectively in production.
- A model can perform well in offline evaluations and still fail in production if the surrounding system is too slow, too expensive, too fragile, or unable to scale.
- Latency and load time matter because they shape the user experience. However, model inference latency is not always the same as user-visible page latency, so you should measure where the delay occurs and whether users can actually perceive it.
- Important system performance metrics include response time, model inference time, application load time, throughput, error rates, timeout rates, fallback rates, and resource utilization.
- For LLM systems, you should also track time to first token, time to final token, tokens per second, retrieval latency, context size, cost per request, retry rate, and fallback rate.
- For agent systems, you should track the number of model calls, number of tool calls, tool latency, tool failure rate, step count, loop rate, and total task completion time.
- Shadow traffic lets you evaluate a candidate model or system using production traffic without exposing users to the candidate output. It is useful for technical readiness, but it cannot measure whether users prefer the new experience.
- Latency degradation experiments help quantify how sensitive product and business metrics are to slower performance. Because these experiments intentionally degrade the user experience for some users, they should be run with limited exposure, guardrails, and predefined stop conditions.
- Engineering performance evaluations should be used alongside offline model evaluations, diagnostic evaluations, and A/B tests. Together, they help teams decide not only whether a model is good, but whether it is ready for production.

 AI Model Evaluation ebook for free
