3 Using offline evaluations as diagnostics
Offline evaluations can do more than measure how well an AI model performs on average; they can also help diagnose why it behaves the way it does. The chapter frames diagnostic evaluation as a way to uncover hidden patterns, biases, weaknesses, and brittleness that performance metrics alone can miss. Using a movie recommender as the main example, it shows how controlled analysis can isolate model behavior from user behavior, making it possible to identify whether differences in output come from genuine preferences or from the model’s internal logic.
A major theme is that diagnostics complement performance evaluation rather than replace it. Aggregate metrics such as recall, precision, and ranking quality answer whether the model is broadly useful, while diagnostic cuts ask where it fails, for whom, and under what conditions. The chapter explains several useful diagnostic metric families: subgroup error analysis, fairness and bias measures such as demographic parity and equality of opportunity, and robustness tests such as noise sensitivity and out-of-distribution gaps. It also extends the same logic beyond recommenders to search, LLMs, and agentic systems, where the goal remains to reveal failures that matter to the product experience.
The chapter closes by emphasizing practical use and implementation. Good diagnostics need clear goals, the right data, meaningful baselines, actionable outputs, and repeatability so they can become part of the development process. Engineering support matters as well: fine-grained logging, interpretable visualizations, careful handling of sensitive data, and tools for fairness and observability all make diagnostics usable in practice. Overall, the message is that diagnostic offline evaluations help teams turn model behavior into product decisions, prioritize improvements, and build systems that are not just accurate, but more robust, fair, and aligned with user needs.
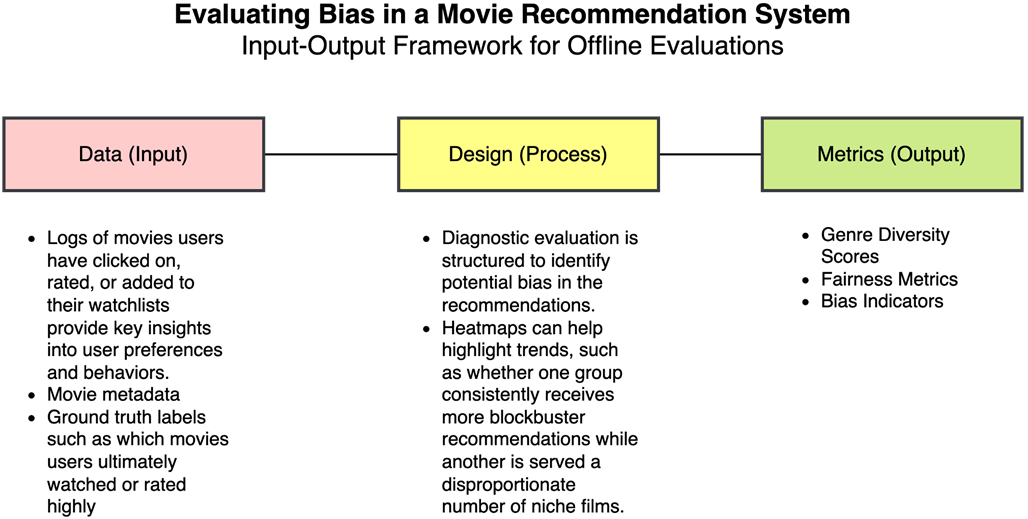
illustrates the input-output framework for diagnostic offline evaluations, showcasing how data, design, and metrics work together to identify potential issues in machine learning models. The input consists of data, such as historical interactions, user metadata, and labeled outcomes, which provide the foundation for the evaluation. The design process defines how this data is analyzed, using tools like subgroup analysis or visualization techniques, to produce actionable metrics like fairness scores or bias indicators as the output.
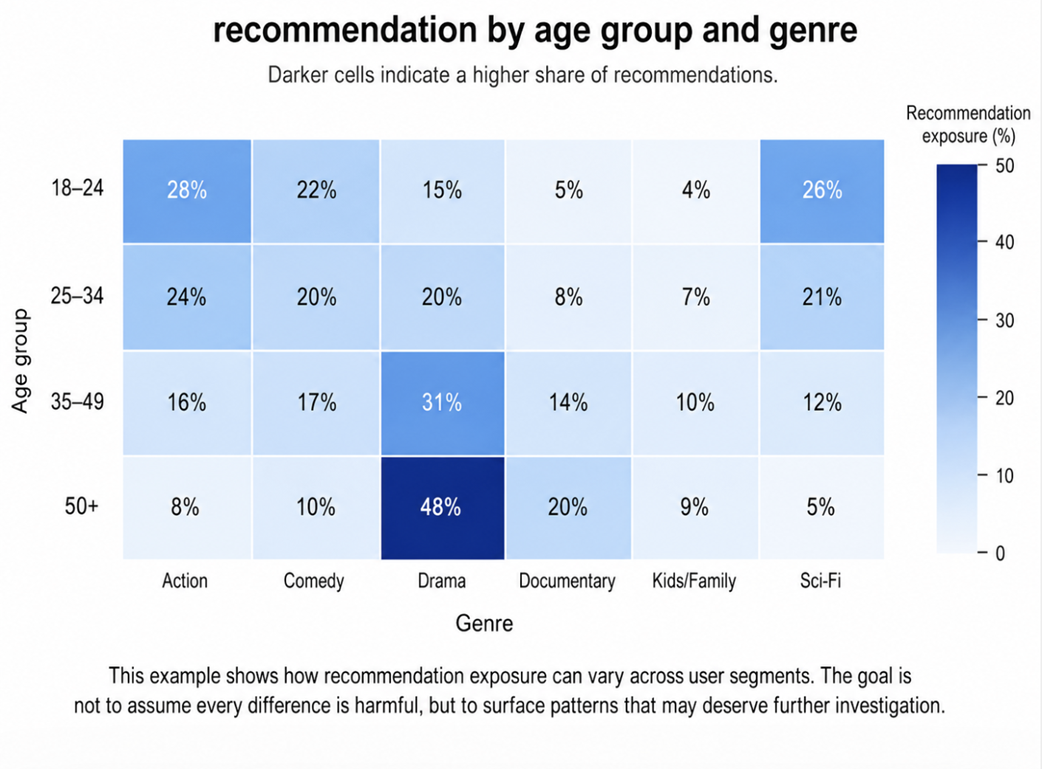
This heatmap shows how recommendation exposure varies by age group and genre. Darker cells indicate higher exposure. The goal is not to assume every difference is a problem, but to identify patterns that may require deeper investigation.
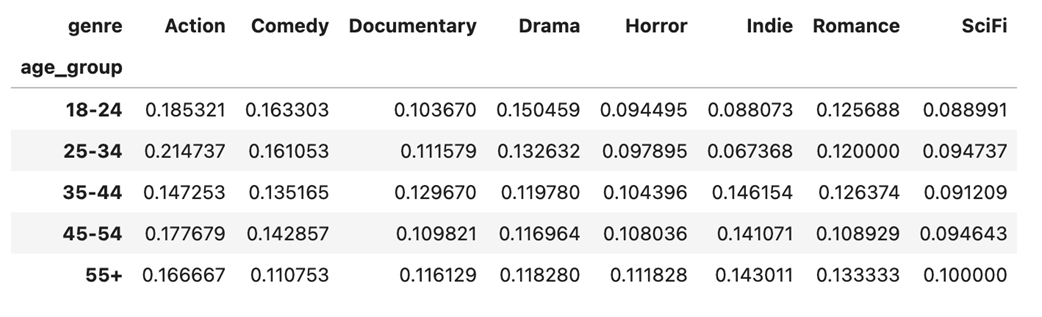
The table shows the results of the bias analysis for genre distribution of movie recommendations across different age groups, an example of a diagnostic offline evaluation. It reveals clear patterns in how the recommendation algorithm treats different demographic segments.
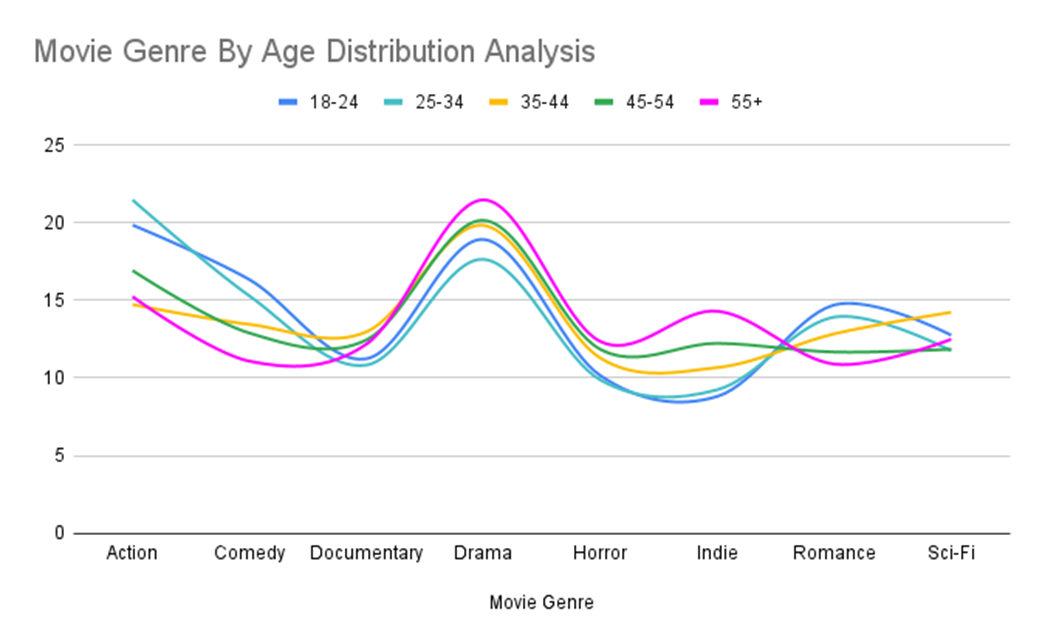
Plot illustrating data from analyzing distribution of genres across age groups. Key patterns include: younger users (18-34) receive disproportionately more Action and Comedy recommendations, while older users (45+) are served more Drama and Indie content. The 25-34 age group shows the highest Action movie recommendations (21.47%), while the 55+ demographic receives nearly double the Indie film suggestions compared to the youngest group.
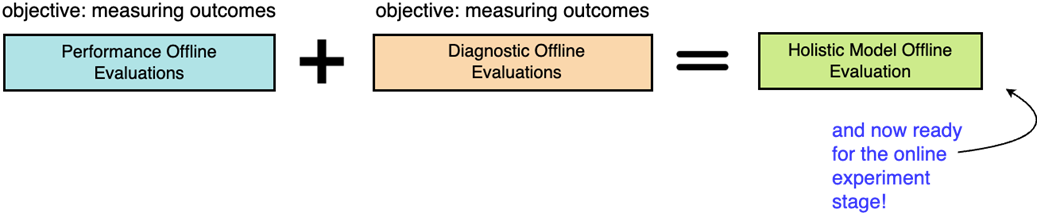
illustrates contrasts performance and diagnostic evaluations in the context of machine learning. Performance evaluations focus on measurable outcomes, like whether the model is meeting its goals, while diagnostic evaluations dig deeper into understanding why the model behaves the way it does, uncovering patterns, biases, and opportunities for improvement. Together, they provide the full picture needed to build reliable and trustworthy models.
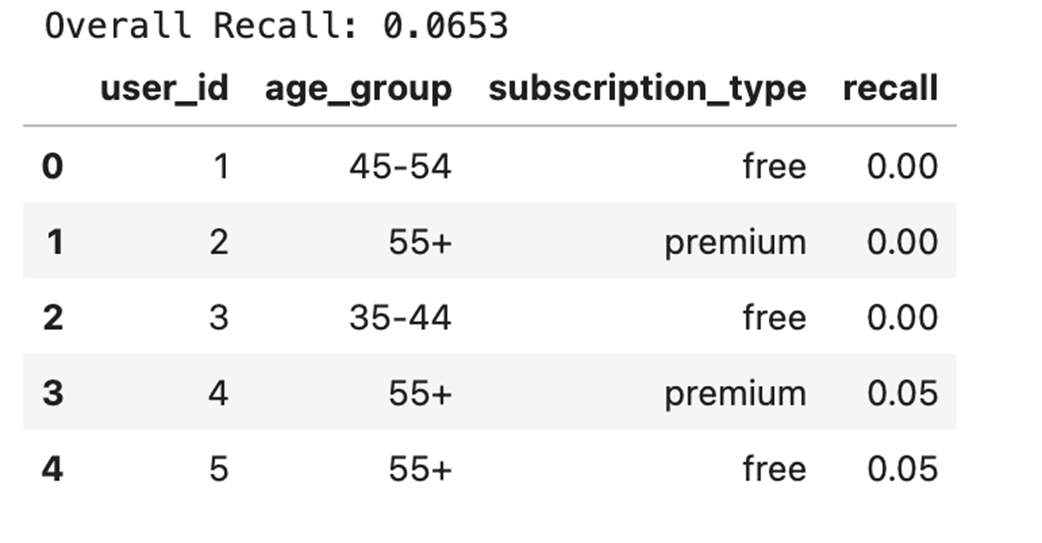
illustrates the overall recall is 0.0653 (6.53%). This is the average recall across all users, and it's quite low. Recall measures what proportion of content a user would actually watch was successfully recommended to them. A recall of only 6.53% means the algorithm is failing to recommend the vast majority (over 93%) of content users would be interested in.
represents how the error rate for a specific subgroup is calculated. In this context, the numerator "number of errors for subgroups" could mean false positives, false negatives, or both, depending on what you're analyzing.

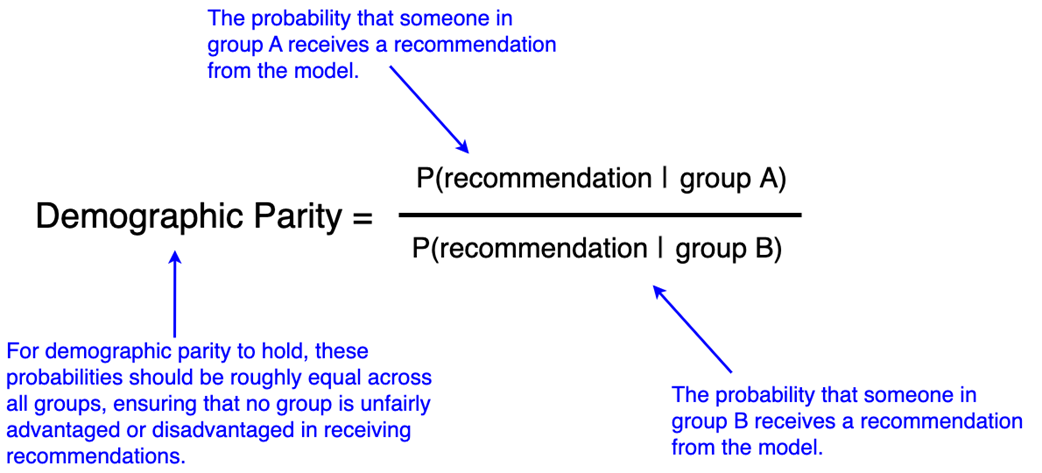
represents how the demographic parity is calculated. The variable P(recommendation|groupA) refers to the probability that someone in group A (e.g., a demographic group like "female users" or "users aged 18-25") receives a recommendation from the model. It measures how often the model recommends something to members of group A compared to other groups. The same applies for P(recommendation|groupB) but for group B. If these probabilities differ significantly between groups, it suggests that the model may not be treating the groups equitably, potentially signaling bias.
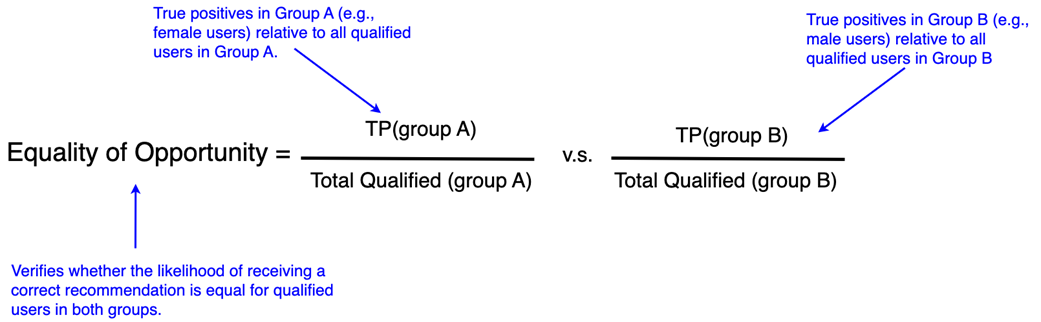
illustrates the equality of opportunity metric, comparing the true positive rates (TP) for two groups (e.g., Group A: female users, Group B: male users) relative to the total number of qualified users in each group. It ensures that qualified users in different demographic groups have an equal chance of receiving a correct recommendation or prediction. Disparities between these rates indicate potential bias in the model.
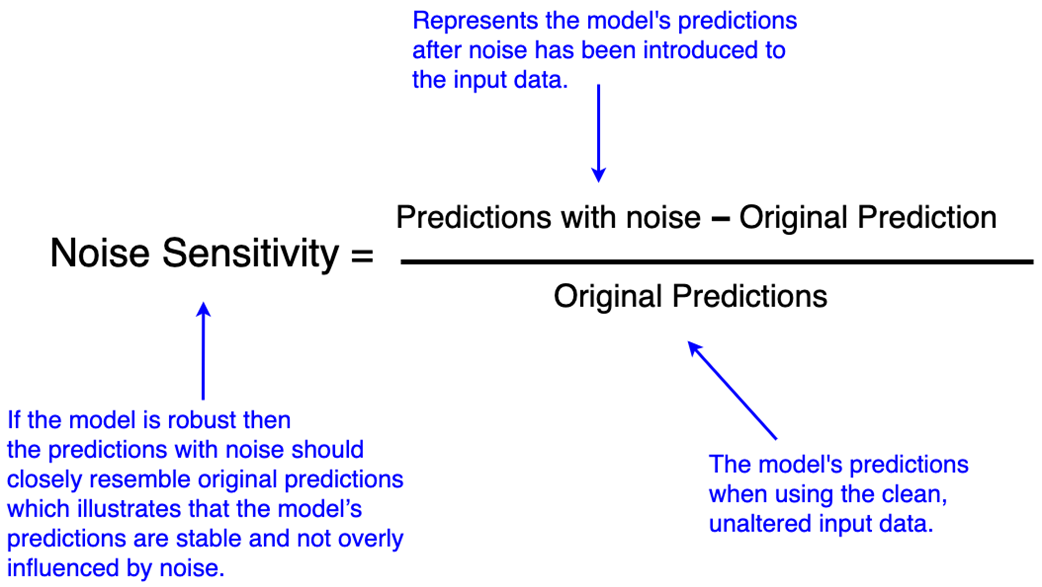
illustrates the formula for noise sensitivity, which measures how much a model’s output changes when noise is introduced to the input data. The numerator represents the difference between the model output on noisy input and the model output on clean input. The denominator normalizes that difference against the original output, making the result easier to compare across examples or model versions.
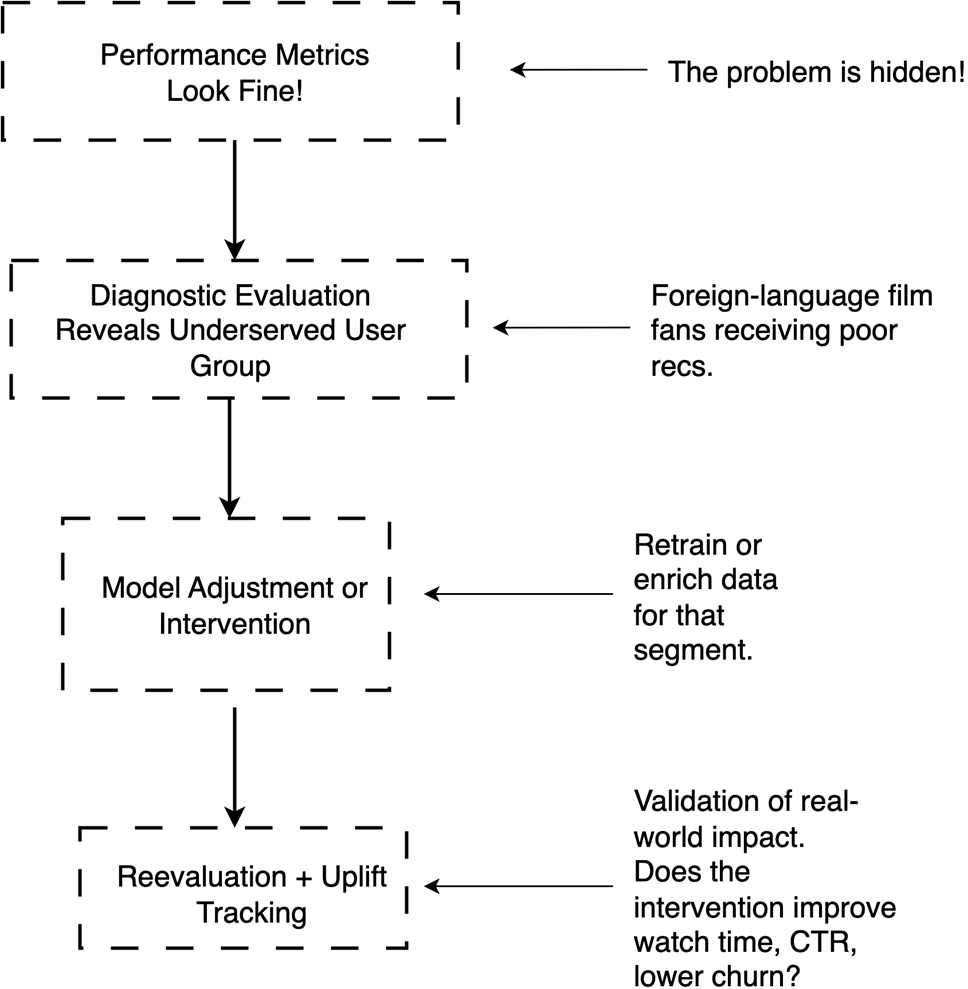
illustrates this decision flow. Performance metrics may look acceptable at first, but diagnostic evaluations can reveal that a specific segment is receiving lower-quality recommendations. That insight leads to a product hypothesis, then a targeted model or data intervention, and finally validation through online or downstream product metrics.
Summary
- While they may not immediately showcase flashy engagement improvements, by computing diagnostic evaluations, you can uncover hidden issues, biases, or weaknesses that performance metrics alone might miss.
- By using metrics like demographic parity or equality of opportunity, diagnostic evaluations can reveal whether a model is treating all user groups equitably.
- Diagnostics bridge the gap between technical model performance and the real-world user experience. For instance, identifying why a recommendation model underperforms for niche user segments can help refine it to better align with product goals, driving user satisfaction and engagement.
- From addressing cold-start challenges to improving robustness against noisy data, diagnostic evaluations have a wide range of applications.
- Diagnostic evaluations can test robustness to noisy inputs, ensuring models handle typos or ambiguous queries effectively.
- In cases of data distribution shifts, diagnostics uncover changing user behaviors, such as increased demand for remote jobs, helping models stay relevant.
- A good diagnostic offline evaluation includes having a clear purpose, the right data, and actionable metrics.
- Implementing diagnostics requires fine-grained logging, tools for visualizing disparities, and responsible handling of sensitive data like demographics.

 AI Model Evaluation ebook for free
