ActiveMQ provides a rich set of ways to observe and control a broker while it is running, and the chapter opens by framing administration as an operational necessity rather than an optional extra. The main foundation for this is JMX, which exposes broker resources as manageable MBeans so that tools and custom programs can inspect statistics, change configuration values, and manage connectors or destinations. The text explains the difference between the JVM’s general JMX agent and ActiveMQ’s own JMX domain, shows how to enable and customize JMX through broker settings and startup-script properties, and demonstrates how remote access, host restriction, and password-based authentication can be configured for safer administration.
Alongside JMX, the chapter introduces advisory messages as a more messaging-native way to learn about broker activity. These advisories are published to special topics and can notify clients when consumers, producers, or connections change, or when messages arrive at a destination with no active consumers. The examples show how to subscribe to advisory destinations, interpret the message payloads, and force advisories by sending nonpersistent messages. This approach lets applications react asynchronously to broker events in the same style as ordinary JMS messaging, which makes it a natural complement to direct management APIs.
The chapter then broadens into practical administration tools and logging. It covers command-line utilities for starting and stopping brokers, listing brokers, querying broker state, and browsing queues, then shows how the command agent can accept management commands through JMS and even through XMPP chat clients. It also walks through JConsole and the web console as convenient interfaces for viewing destinations, inspecting properties, and sending simple test messages. Finally, the chapter explains how to tune broker and client logging, reload logging settings at runtime, trace client-broker communication in detail, and use the logging broker plugin to capture internal broker events for debugging and operational insight.
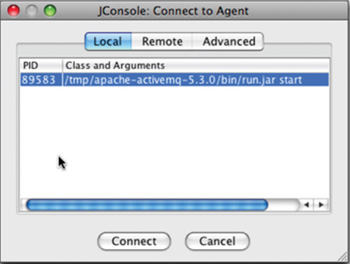
Accessing ActiveMQ locally from JConsole
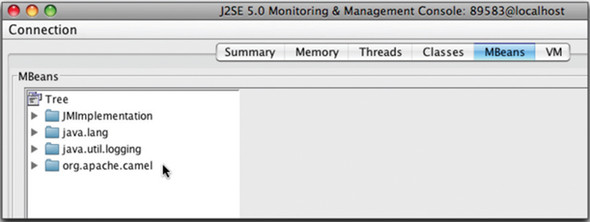
The main JConsole screen with the ActiveMQ domain included
The main JConsole screen without the ActiveMQ domain included
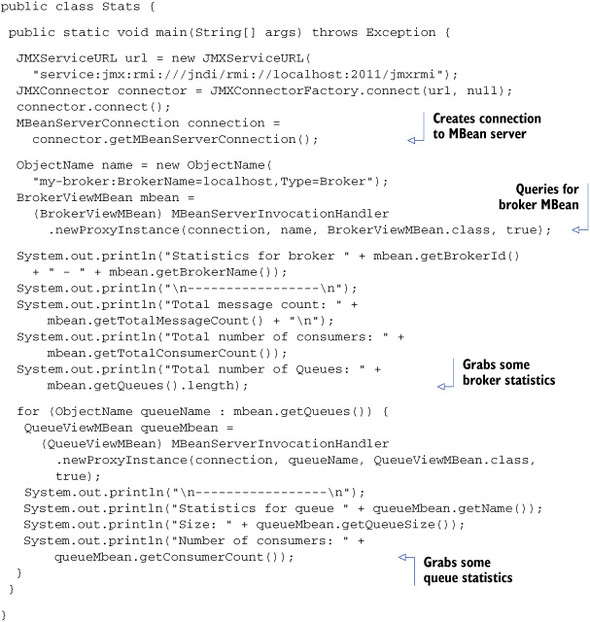
Listing 14.2. ActiveMQ broker statistics
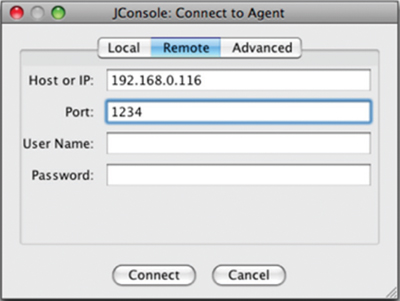
Accessing the JMX agent remotely on port 1234
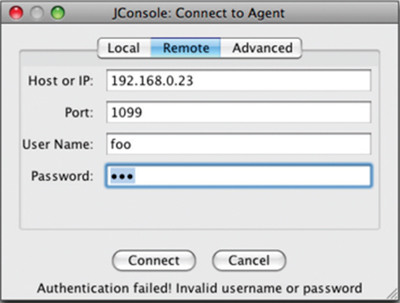
Attempting to remotely connect to the JMX agent with the wrong role name and password
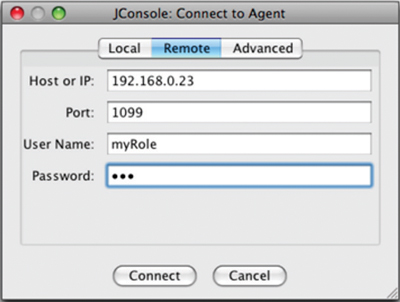
Making a successful remote connection to the JMX agent requires the correct role name and password.
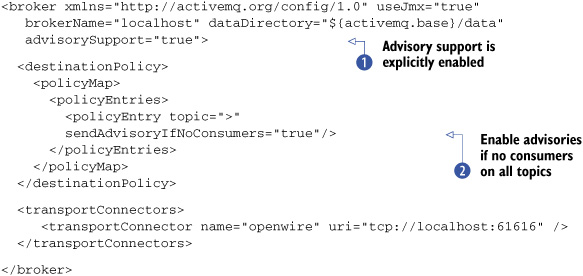
Listing 14.3. Configuring advisory support
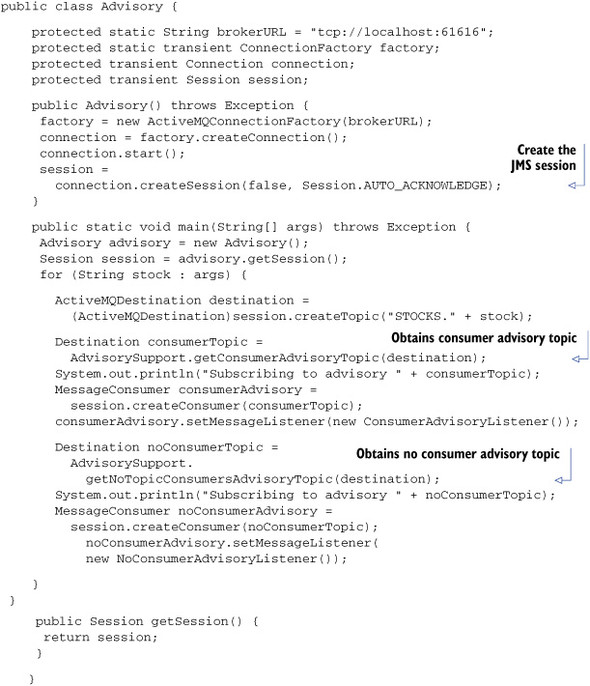
Listing 14.5. Advisory example
Listing 14.6. Consumer advisory listener
Connecting to the broker’s agent topic using XMPP (chat) client
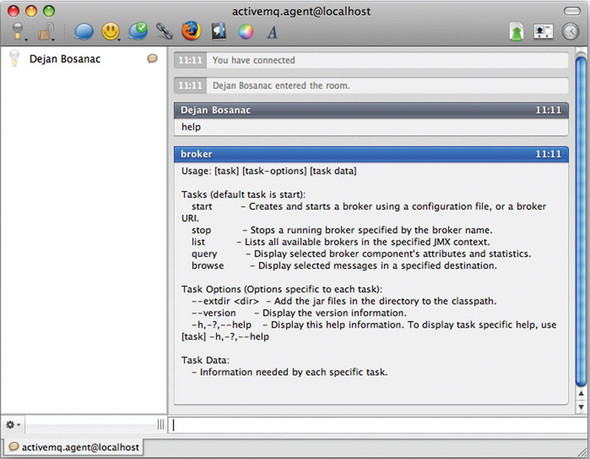
The result of executing help in XMPP client using the command agent
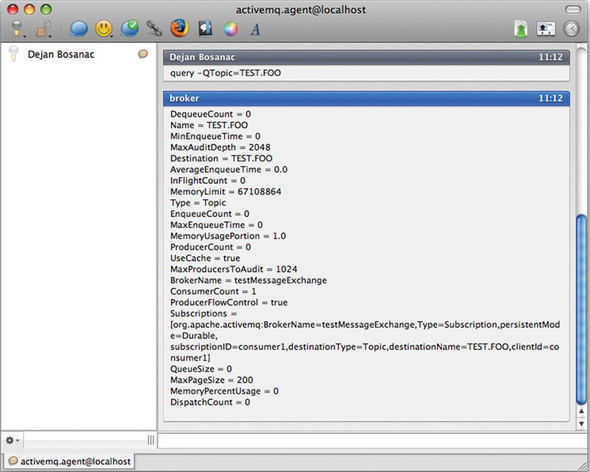
The result of executing query in XMPP client using command agent
Connecting to ActiveMQ using JConsole
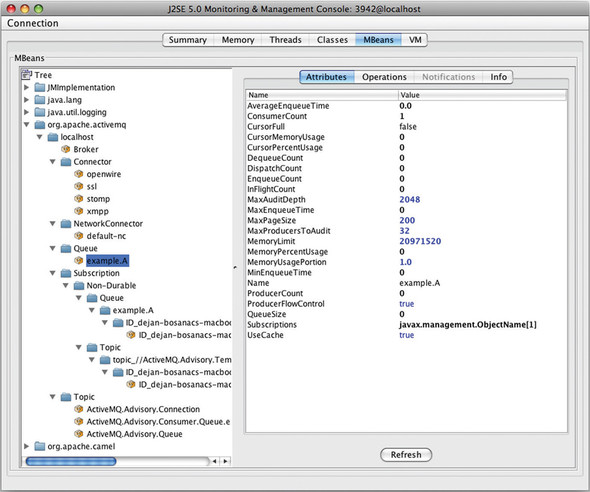
Viewing queue properties using JConsole
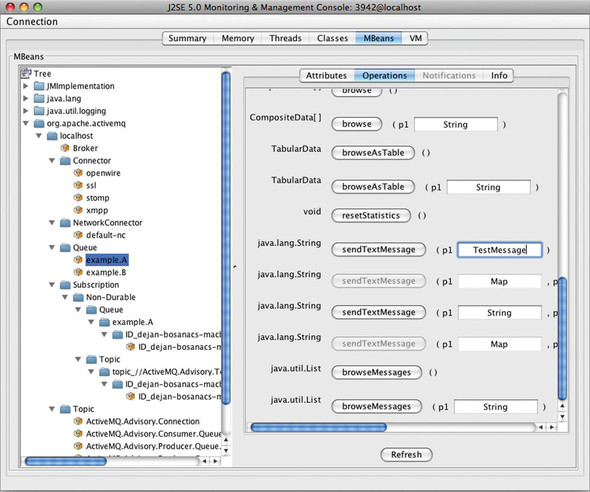
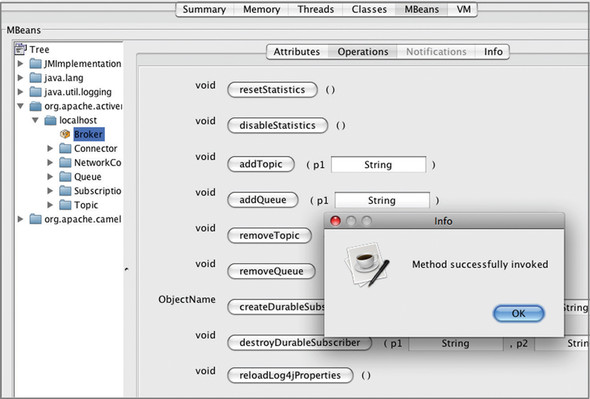
Executing queue operations using JConsole
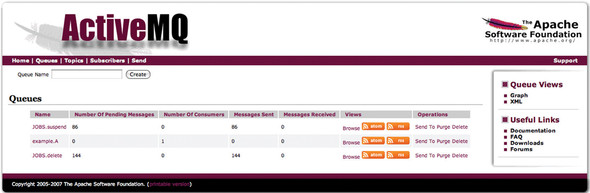
Show all queues via the web console page
View a message via the web console page
Reload Log4J config using JConsole
FAQ
What is JMX, and why is it important for monitoring ActiveMQ?JMX (Java Management Extensions) is the standard Java API for managing and monitoring applications at runtime. ActiveMQ exposes broker management features through JMX so you can inspect statistics, change configuration properties, and manage broker resources while the broker is running.What kinds of broker tasks can be performed through ActiveMQ’s JMX MBeans?Through JMX MBeans, you can obtain broker statistics such as message and consumer counts, add or remove connectors, and change certain broker configuration properties. JMX provides programmatic access to broker management data and operations.What is the difference between local and remote JMX access in ActiveMQ?Local JMX access lets tools like JConsole connect to the JVM running ActiveMQ on the same machine using the default JMX agent. Remote JMX access requires exposing the JMX agent on a specific port, such as by setting com.sun.management.jmxremote.port, so management tools can connect from another host.How do you enable or disable ActiveMQ’s JMX support?ActiveMQ’s JMX support is controlled by the broker’s useJmx attribute. It is enabled by default, but setting useJmx="false" disables the ActiveMQ domain in JMX, even though the JVM’s JMX agent may still be available.How can you change the JMX domain name and connector port used by ActiveMQ?You can customize these settings in the broker configuration using the <managementContext> element. For example, connectorPort changes the JMX connector port, and jmxDomainName changes the domain name used for ActiveMQ MBeans.What are advisory messages in ActiveMQ?Advisory messages are special broker notifications sent as JMS messages to topics beginning with ActiveMQ.Advisory. They inform clients about broker events such as consumers connecting or disconnecting, and can also report more complex events like messages being sent to destinations without consumers.Why must nonpersistent messages be used in the advisory example for “no consumer” notifications?ActiveMQ sends “no consumer” advisory messages only for nonpersistent messages. That is why the example modifies the producer to use DeliveryMode.NON_PERSISTENT, ensuring the broker emits advisory notifications when messages are sent to a destination with no active consumers.What does the activemq-admin command-line tool allow you to do?The activemq-admin script can start and stop brokers, list available brokers, query broker state, and browse destinations. It is useful for quick administration and inspection from the command line, especially in environments where GUI tools are not practical.How is JConsole used with ActiveMQ?JConsole connects to ActiveMQ through JMX and lets you inspect MBeans, view broker and destination statistics, and execute operations. For example, you can browse queue properties and even invoke operations like sending a test message from the Operations tab.How can ActiveMQ logging be adjusted to help diagnose problems?ActiveMQ logging is configured through conf/log4j.properties. You can raise logging to DEBUG or TRACE for specific packages, reload the configuration at runtime through JConsole, and also enable the logging broker plugin to capture internal broker events such as connections, sessions, and message activity.
pro $24.99 per month
access to all Manning books, MEAPs, liveVideos, liveProjects, and audiobooks!






 ActiveMQ in Action ebook for free