This final project serves as a capstone to the book by encouraging readers to apply the pandas skills they have learned to a rich, real-world data set about U.S. higher education. The work centers on two compressed CSV files from the college scorecard: one describing institutions and another describing fields of study. The chapter emphasizes that the data are broad enough to support many different questions, and it invites further exploration beyond the exercises provided.
The first part of the project focuses on building and preparing data frames efficiently. Readers load only the columns they need, then use grouping, filtering, sorting, and categorical conversion to answer questions about where universities are concentrated, how many programs they offer, and how much memory can be saved by using categories. The chapter also introduces visual summaries such as histograms and pie charts to show distributions of bachelor’s and graduate programs, and it demonstrates how to use joins to combine institution-level and program-level data when needed.
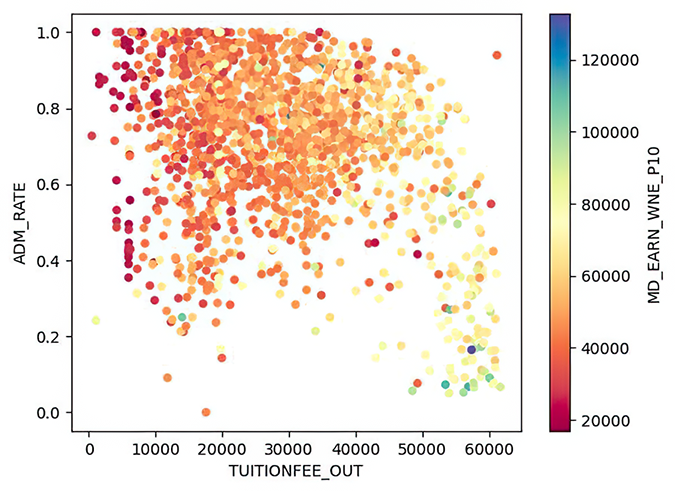
The second part uses the data to explore tuition, selectivity, financial aid, and outcomes. It examines relationships between tuition and admission rates, tuition and earnings, and completion and selectivity. It also compares public, private nonprofit, for-profit, and “Ivy Plus” institutions in terms of cost and post-graduation income, and looks at state-by-state earnings patterns through grouped summaries and plots. Overall, the chapter reinforces that pandas can reveal broad trends and interesting exceptions, while also reminding readers not to confuse aggregate patterns with judgments about any single school or student.
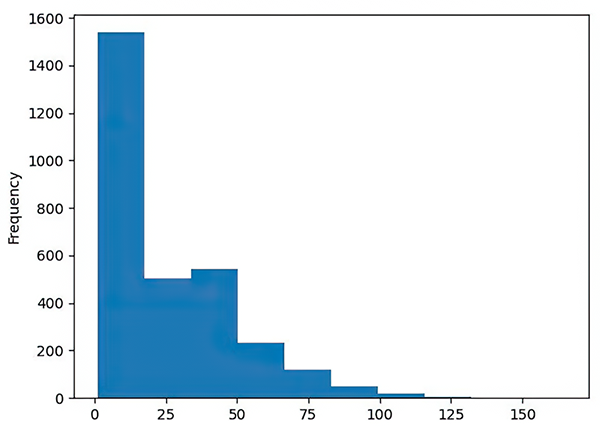
Histogram showing how many schools offer different numbers of bachelor’s programs
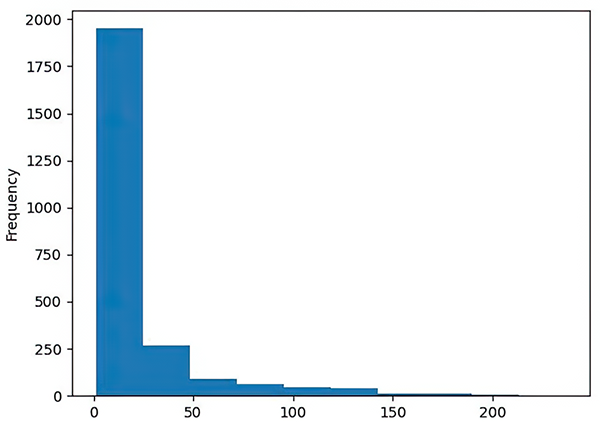
Histogram showing how many schools offer different numbers of graduate programs
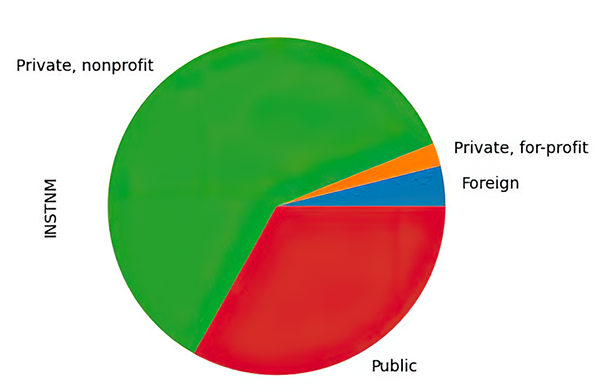
Pie chart comparing the types of institutions that offer computer science
Scatter plot comparing tuition fees and admission rates
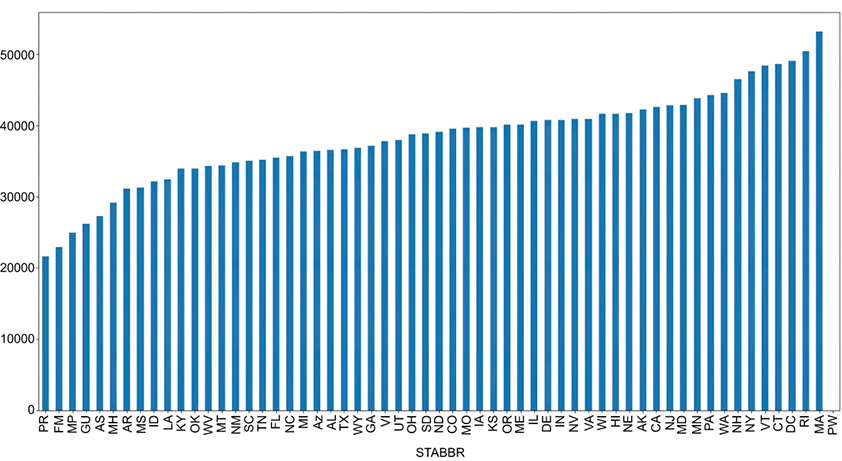
Bar chart showing the average amount earned per state
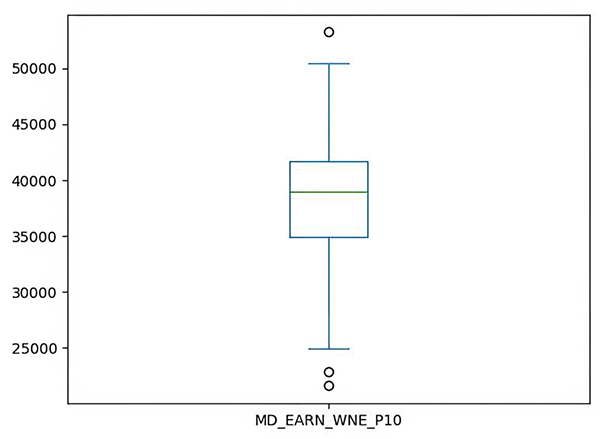
Boxplot showing the average salaries earned by graduates
Summary
You’ve now come to the true and actual end of the book. Thanks for joining me on this journey. I hope the exercises in this book, including all the extra “Beyond the exercise” questions, have helped improve your understanding of pandas and how to load, clean, and analyze data in a variety of ways.
Beyond the specific techniques I’ve covered in this book, I hope you’ve also begun to internalize the pandas perspective on data analysis. Pandas is a huge (and constantly growing) library, and there’s no way for someone to know all of it. Understanding how pandas works means when you’re faced with a new problem, you can guess how to solve it, even predicting what methods pandas will provide to do so.
I wish you the best of success in your use of pandas to analyze data in whatever you’re doing. And I hope this book helped you to advance your skills in that area. If it did, please drop me a line at reuven@lerner.co.il! I’m always delighted to hear from people who have read my books.
FAQ
What data files are used in the chapter 13 final project?
The final project uses two compressed CSV files: one with institution-level college scorecard data and one with fields-of-study data. The institution file is loaded intoinstitutions_df, and the fields-of-study file is loaded into fields_of_study_df.Which columns should be loaded into institutions_df?
Load only the columns needed for the analysis: OPEID6, INSTNM, CITY, STABBR, FTFTPCTPELL, TUITIONFEE_IN, TUITIONFEE_OUT, ADM_RATE, NPT4_PUB, NPT4_PRIV, NPT41_PUB, NPT41_PRIV, NPT45_PUB, NPT45_PRIV, MD_EARN_WNE_P10, and C100_4.Which columns should be loaded into fields_of_study_df?
Load the columns OPEID6, INSTNM, CREDDESC, CIPDESC, and CONTROL.What state has the greatest number of universities in the database?
Group bySTABBR, count institutions, sort descending, and take the top result. In the chapter’s example, California has the most universities.What city and state have the greatest number of universities in the database?
Group by bothSTABBR and CITY, count institutions, and sort descending. In the chapter’s example, New York City, New York has the most institutions.How much memory can be saved by making CITY and STABBR categorical?
Measure memory usage before and after converting both columns to category dtype. The chapter reports a savings of 579,371 bytes on the author’s system.How many universities offer bachelor’s degrees but not master’s or doctoral degrees?
Build a list of schools with bachelor’s programs, remove any schools that also appear in the graduate-program list, drop duplicates, and count the remaining schools. The chapter’s result is 923 institutions.How many universities offer master’s and doctoral degrees but not bachelor’s degrees?
Build a list of schools with master’s or doctoral programs, remove any schools that also appear in the bachelor’s list, drop duplicates, and count the remaining schools. The chapter’s result is 404 institutions.How many institutions offer bachelor’s degrees in computer science?
Filter rows whereCIPDESC contains “Computer Science” and CREDDESC equals 'Bachelors Degree', select INSTNM, take unique school names, and count them. The chapter reports 762 institutions.Which type of institution offers the most undergraduate computer science programs?
Filter for bachelor-level computer science programs, group byCONTROL, and count institutions. The chapter reports that private nonprofit institutions offer the most undergraduate CS programs, followed by public, foreign, and private for-profit institutions.
 Pandas Workout ebook for free